

Security Overview
Routebase includes a purpose-built scanner that tests your running APIs against the OWASP API Security Top 10 (2023). Because the scanner already knows your API specification — every endpoint, method, parameter, and request body schema — it sends targeted probes instead of blindly crawling, which keeps false positives low and maps every result straight back to the endpoint it came from.
This guide is the map of the whole Security area: what a scan is, how findings and the security score work, and where each piece lives. For the exact behaviour of each scanner see the Scanner reference.
Plan and access
Security scanning is a Pro plan feature. On Free and Starter plans the Security area shows an upgrade prompt instead of the tools. Security also works in a project context — open a project first, or you'll see a prompt to pick one.
Access is gated by role:
| Action | Permission | Who has it |
|---|---|---|
| View dashboard, scan runs, findings | security:read | Members, Admins, Owners |
| Create/edit scan profiles and personas, triage findings | security:write | Admins, Owners |
| Run scans, cancel runs, test personas | security:execute | Admins, Owners |
Members can read everything but cannot start scans, edit profiles, or change a finding's status.
The Security area
The Security sidebar has five pages:
| Page | What it's for |
|---|---|
| Dashboard | Score, severity breakdown, trend, recent scans, and the most-affected endpoints. |
| Scan Profiles | Reusable scan configurations. Create, edit, schedule, and trigger runs. |
| Scan Runs | History of every scan execution with status, score, and timing. |
| Findings | The triage list — every issue the scanners raised, with filters and status workflow. |
| Personas | Stored auth identities used by scanners that test authorization. |
Dashboard
The dashboard is the landing page for a project's security posture. Until a project has completed its first scan it shows a Start your first security scan empty state with a three-step guide: create a scan profile, run your first scan, review findings.
Once a scan has run, the dashboard shows:
- The Security Score card (see below), plus mini stat cards for Critical, High, and combined Medium / Low open-finding counts.
- A security score trend chart over the last 30 days.
- A severity breakdown of open findings.
- A recent scans timeline.
- A top affected endpoints card ranking the endpoints with the most open findings.

Running scans
A scan is driven by a scan profile — a saved configuration that names the target environment, the API specification, which scanners to run, and the rate limits. You can trigger a profile manually from the Scan Profiles page or give it a cron schedule to run automatically. Each execution is a scan run.
The full profile lifecycle is covered in Scan profiles. In short:
- Confirm your target environment has a base URL and that the API is reachable from Routebase.
- If you want to test authorization flaws, add security personas.
- Create a scan profile, pick your scanners, and click Run.
Scan run view
Clicking Run takes you to the live run view, which refreshes automatically while the scan is active (it polls every few seconds while a run is Queued or Running). It shows:
- A status badge — Queued, Running, Completed, Failed, or Cancelled.
- A progress bar measured as scanners completed out of scanners enabled, plus the id of the scanner currently executing.
- Counters for Checks, Passed, Failed, and Open findings.
- A Cancel scan button (requires security:execute). Cancellation is cooperative: in-flight work is allowed to finish and all findings detected up to that point are preserved. The run is marked Cancelled.
The Scan Runs page lists every past run with its status, resulting score, open-findings count, enabled-scanner count, trigger, start time, and duration.
Findings
Every time a scanner detects a potential issue it raises a finding. The Findings page is where your team triages them.
The findings list
The list is a table with columns for Severity, Title, Method, Path, Status, and Assigned to. A filter bar above it lets you:
- Search by title.
- Filter by status (Open, In progress, Fixed, False positive, Accepted risk, Duplicate) or All statuses.
- Filter by severity (Critical, High, Medium, Low, Info) or All severities.
- Sort by Severity (default), Last seen, or First seen.
- Restrict to findings assigned to me.
Severity and confidence
Each finding carries a severity and a confidence.
| Severity | Meaning |
|---|---|
| Critical | Exploitable, severe impact — fix immediately. |
| High | Significant issue — fix promptly. |
| Medium | Moderate risk, usually needs specific conditions. |
| Low | Minor issue with limited impact. |
| Info | Informational observation, not a vulnerability. |
| Confidence | Meaning |
|---|---|
| High | Strong evidence — very likely real. |
| Medium | Reasonable evidence, may need manual verification. |
| Low | Weak or indirect signal — review before acting. |
Finding detail
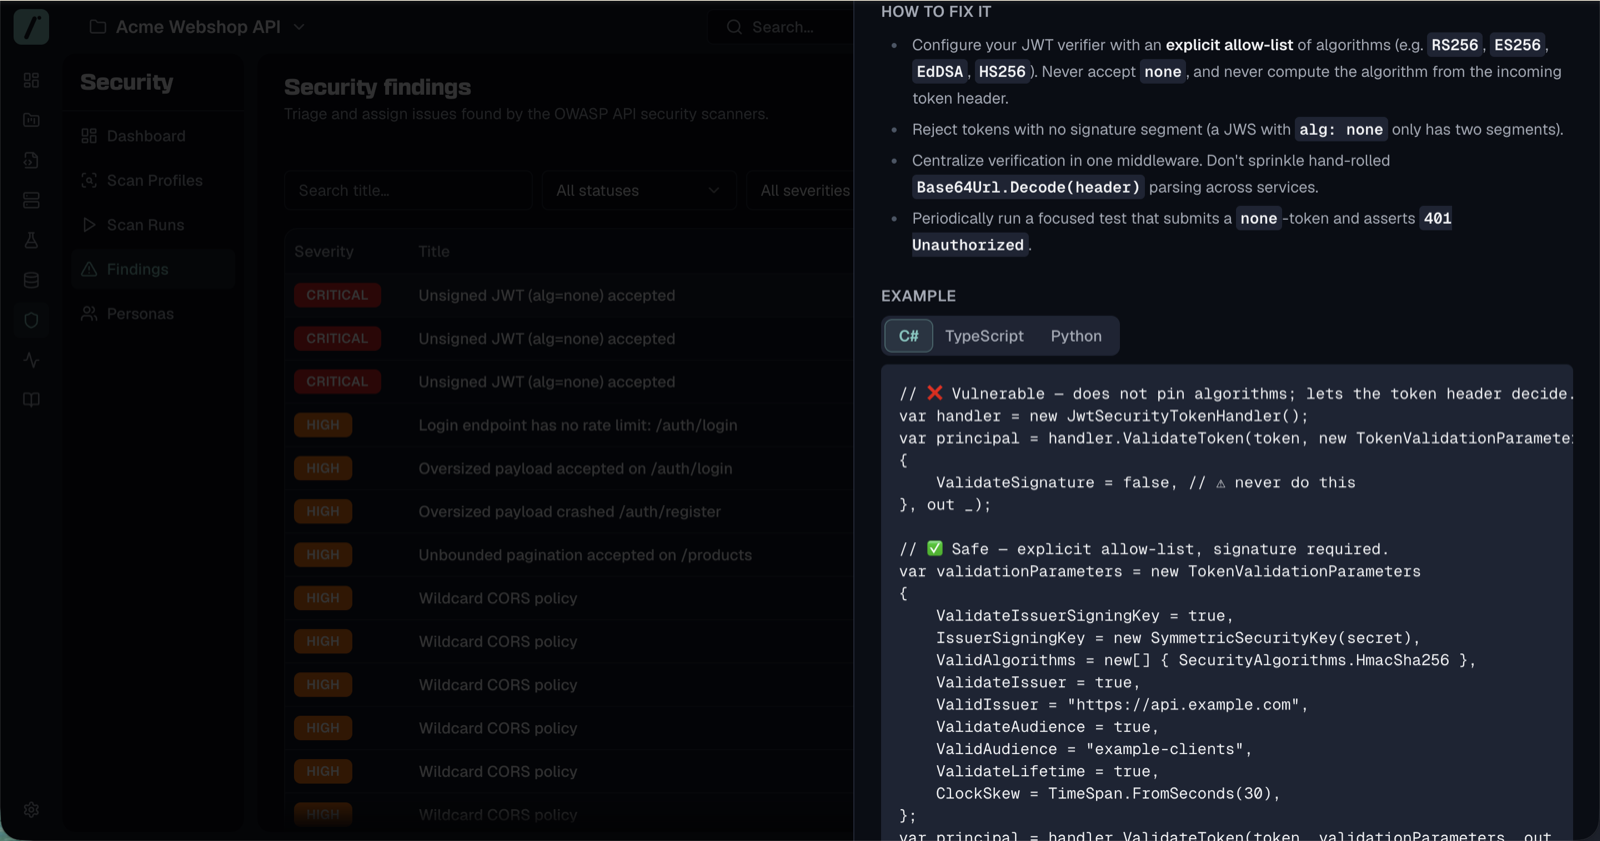
Selecting a finding opens a side sheet with three tabs:
- Overview — the scanner that raised it, confidence, who it's assigned to, when it was resolved, any resolution notes, and the full description.
- Evidence — a ready-to-run reproduction
curlcommand (with a copy button) so you can verify the issue independently. A Show raw evidence button lazily loads the scanner's full evidence payload as pretty-printed, copyable JSON (its shape varies per scanner) for pasting into an issue tracker. - Guidance — remediation content for the finding's OWASP category: what the issue means, how to fix it, code examples (C#, TypeScript, Python where available), and reference links to OWASP and CWE.
Triaging findings
With security:write, the detail sheet exposes a Status control. Findings follow a fixed workflow:
| Status | When to use |
|---|---|
| Open | Default state after detection. |
| In progress | Someone is actively working on a fix. |
| Fixed | The underlying vulnerability is resolved. |
| False positive | Not actually a vulnerability. |
| Accepted risk | Acknowledged but intentionally not fixed. |
| Duplicate | A duplicate of another finding. |
You can move a finding between Open and In progress freely. Moving it to a resolving status (Fixed, False positive, Accepted risk, or Duplicate) opens a dialog that requires a short resolution note explaining the decision — that note is saved with the finding. Resolved findings cannot be reopened by hand; if a later scan detects the same issue again, the scanner reopens it automatically.
Bulk triage
To triage many findings at once, tick the checkbox on each row (or the Select all findings checkbox in the table header). A selection bar then appears above the table showing the count (e.g. 3 selected) with quick actions: Mark in progress, Mark fixed, and Mark false positive, plus Clear to drop the selection. Each action applies the one target status to every selected finding. The backend enforces the same per-finding state machine as single triage, so any finding whose current status can't legally make that transition is skipped rather than forced. Bulk triage requires security:write — the selection controls don't appear for Members.
Security score
The security score is a single 0–100 indicator of a project's posture, recalculated from open findings.
How it's calculated
The score starts at 100 and subtracts penalties for open findings only (findings that are In progress, Fixed, False positive, Accepted risk, or Duplicate do not reduce the score):
| Severity | Penalty per finding | Penalty cap |
|---|---|---|
| Critical | −25 | −60 |
| High | −10 | −30 |
| Medium | −3 | −15 |
| Low | −1 | −5 |
Two small bonuses reward active scanning:
- +2 if the project has a completed scan within the last 7 days.
- +3 if at least one enabled scan profile has a schedule.
The result is clamped to the 0–100 range.
Score bands
The dashboard score card colours the number by band:
| Score | Label | Colour |
|---|---|---|
| 80–100 | Good | Green |
| 50–79 | Fair | Amber |
| 0–49 | Poor | Red |
Governance
The security score also feeds the project's overall governance score as one weighted component (20% by default; the weight is configurable in governance settings). A project that has never been scanned contributes no security component to governance.
Defensive limits
To keep scans bounded and storage manageable, the module enforces hard limits:
| Resource | Limit |
|---|---|
| Endpoints processed per scan | 500 |
| Personas per project | 10 |
| Scan profiles per project | 10 on Pro; unlimited on Enterprise |
| Findings per project | 10,000 |
When the findings cap is reached, the oldest resolved findings are archived automatically to make room; open findings are never archived. Creating a persona or a profile beyond the limit is rejected with a validation error — delete an unused one first.
Related
- Scanner reference — what each scanner checks and the severities it raises
- Security personas — the auth identities that power authorization testing
- Scan profiles — building and scheduling scan configurations
- Security in CI/CD — running scans from a pipeline and exporting findings as SARIF
- Environments — where the scan target's base URL is defined