

Alert Policies
An alert policy is a reusable set of alert rules you define once and assign across your project, so you do not configure alerts on every monitor by hand. A policy can cover whole environments, API specs or individual monitors. Manage them under Monitoring → Alert Policies. Creating and editing policies requires the monitoring:write permission.
Alert types
Every rule belongs to one of four alert types, each with its own condition:
| Alert type | Fires when | Settings (defaults) |
|---|---|---|
| Downtime | A run of consecutive checks fail. | Consecutive failures (3) |
| Latency Threshold | Average response time over a window of checks exceeds a limit. | Threshold in ms (2000), window in checks (5) |
| Error Rate | The share of failing checks in a window crosses a percentage. | Threshold in % (50), window in checks (10) |
| Schema Drift | Drift of at least a chosen severity is detected. | Minimum severity (Error; also Warning, Info) |
The minimum severity on the Schema Drift rule is what decides how sharp a drift alert is. Error covers the breaking changes, such as a required field gone missing or a type that changed, while Warning also fires on deviations such as fields the spec does not mention. See Contract Drift.
Every rule also has a cooldown, which is the minimum number of minutes between repeat alerts and defaults to 30, so a sustained problem does not flood you with notifications.
Creating a policy
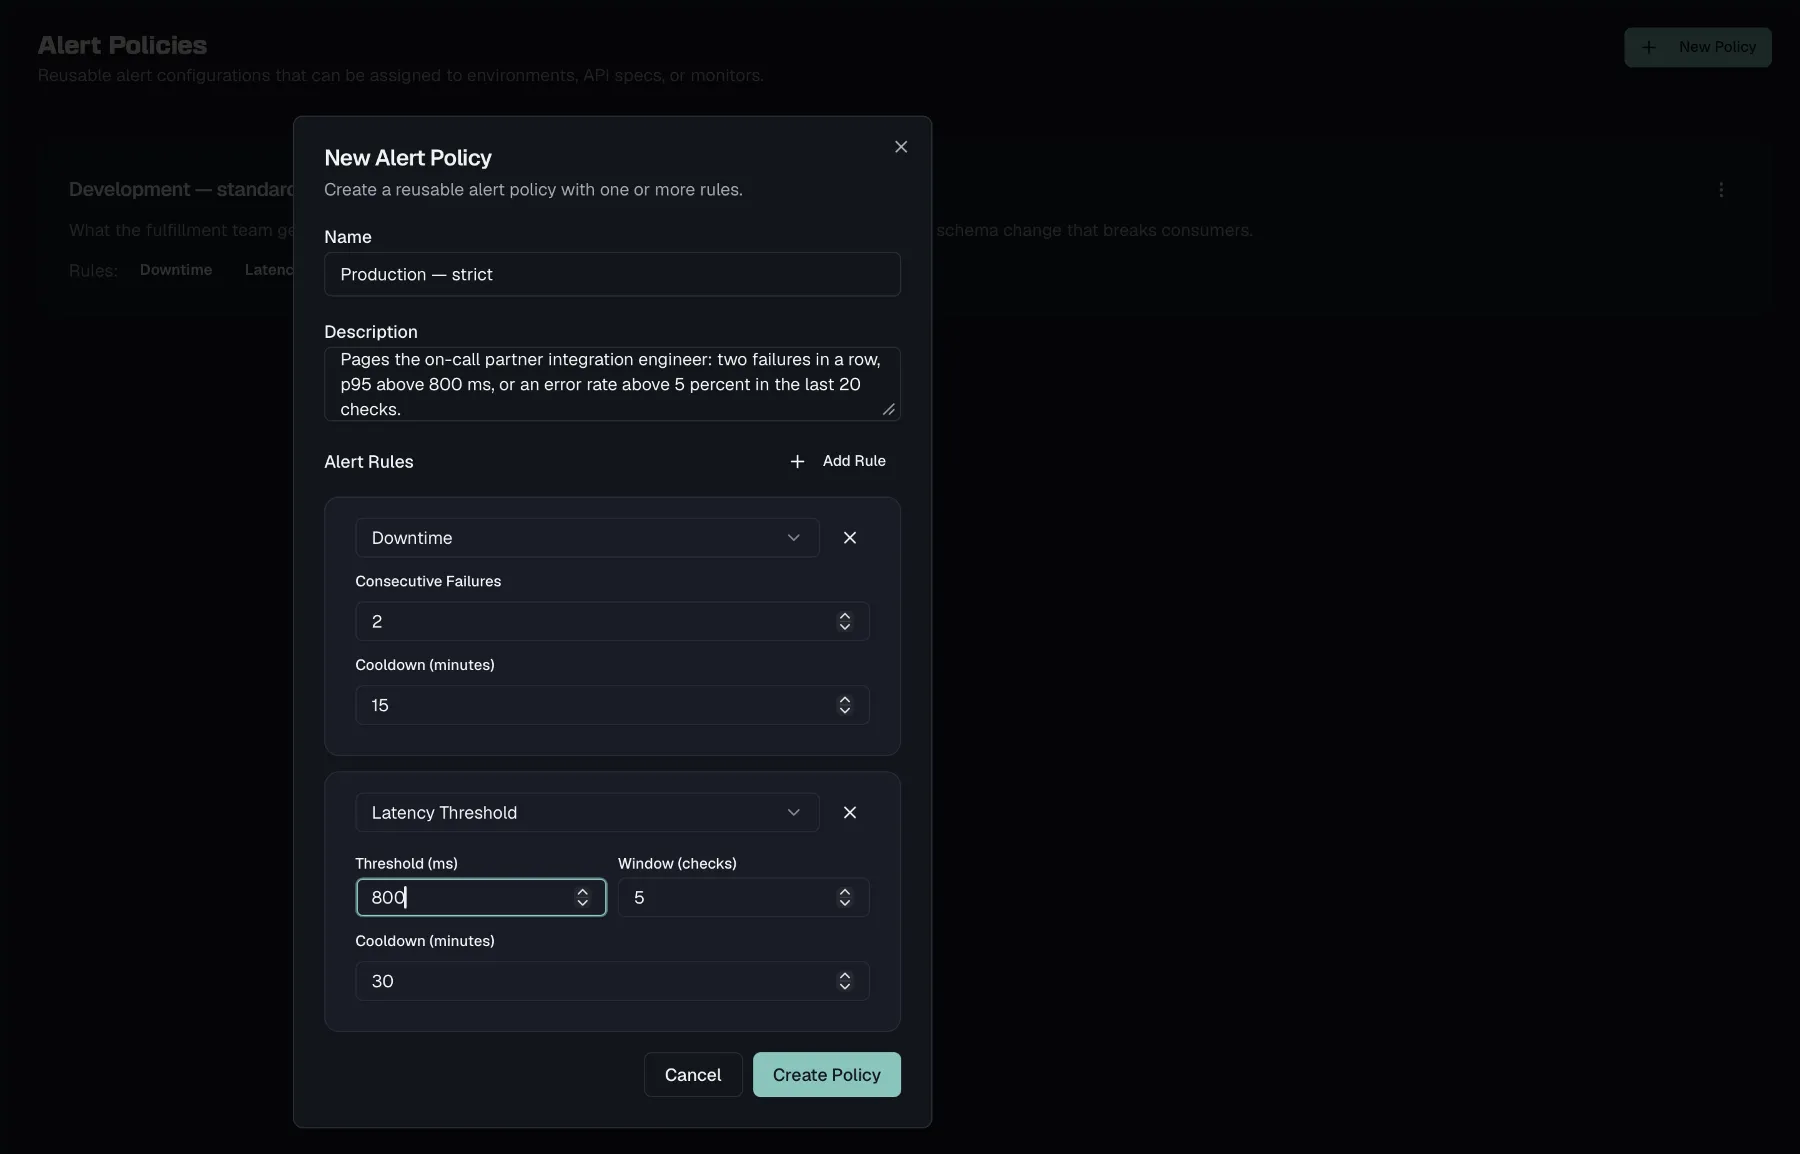
- Open Alert Policies and click New Policy.
- Give it a Name such as Critical Alerts, and an optional Description.
- Click Add Rule and configure the rule's type, condition and cooldown. A policy holds at most one rule per alert type, so up to four rules, and it needs at least one rule to be saved.
- Click Create Policy.
When editing an existing policy, the dialog additionally shows an Enabled switch. Disabled policies stop alerting everywhere they are assigned, and they cannot be newly assigned.
Each policy card in the list shows its rule types and its assignment count, plus a Default or Disabled badge where applicable. The policy marked Default applies automatically to monitors that have no other assignment, and it cannot be deleted. Deleting any other policy also removes all of its assignments.
Assigning policies
You assign a policy at three scopes from the monitor tree on the Monitors page. Right-click an environment, an API spec or a single monitor and choose Assign Alert Policy. Only enabled policies appear in the picker, and the default policy is labeled (Default).
Because a monitor can be covered by assignments at more than one level, Routebase resolves an effective policy per monitor, with the most specific scope winning. A direct monitor assignment beats its spec, which beats its environment, which beats the project default. When an incident opens, its detail names which policy triggered it.
Note that the winning policy replaces the less specific one entirely rather than merging with it. A spec-scoped policy with only a drift rule therefore leaves that spec's monitors with no downtime alerting at all, which is why the one Routebase creates for you brings its own downtime rule along.
The "Contract Drift Watch" policy
If you find a policy by that name in the list without having created it, drift watch made it. Choosing Any contract deviation as the alert sharpness there needs a warning-severity drift rule, and the seeded default policy alerts on errors only. A spec-scoped policy is therefore created and assigned to that specification, carrying two rules:
- Schema Drift at warning severity with a 60-minute cooldown, which is the reason the policy exists.
- Downtime after 3 consecutive failures, which mirrors the default rule and is present because a spec-scoped policy replaces the project default wholesale.
Choosing Breaking changes only creates nothing, because the default policy already covers error-severity drift and drift watch never modifies it. Re-running the dialog with a different sharpness updates the same policy instead of adding a second one. Disabling drift watch leaves the policy in place, and without validation results its drift rule cannot fire anyway.
Per-monitor custom alerts
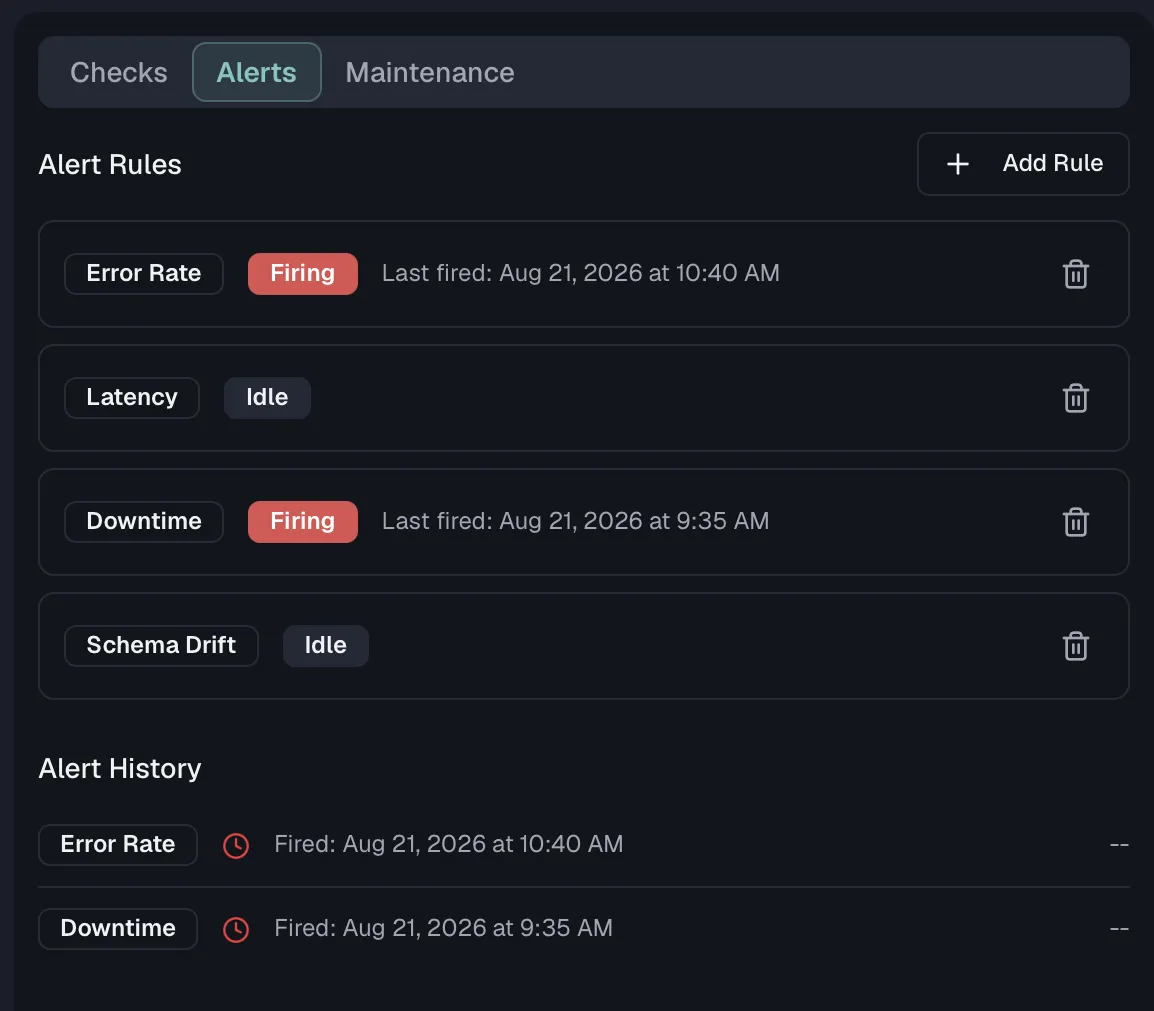
When one monitor needs something its policy does not cover, add rules directly on the monitor. Open the monitor's detail page, switch to the Alerts tab, then click Add Rule. The New Alert Rule dialog offers the same four alert types with slider-based conditions:
| Alert type | Ranges |
|---|---|
| Downtime | Consecutive failures 1–10 |
| Latency Threshold | Threshold 100–30000 ms, window 1–20 checks |
| Error Rate | 1–100%, window 5–50 checks |
| Schema Drift | Minimum severity Error, Warning or Info |
Cooldown is set in 5-minute steps from 5 to 120 minutes. Each rule in the list shows when it last fired, plus its current state as Idle, Firing or Acknowledged. Click a rule to edit it, where you can toggle Enabled and adjust the cooldown, or use the trash icon to delete it.
Below the rules, Alert History lists past firings with when each alert fired, when it resolved, and how long it lasted.
How alerts reach you
Fired alerts and the incidents they open appear in the in-app notification center under the Monitoring category. Whether you also get them by email is controlled per category in your notification preferences.
They can also land in a chat channel. Slack and Microsoft Teams are first-class delivery targets with their own Contract drift and Incidents & recovery categories, formatted for the client rather than posted as raw JSON. A drift alert arrives with the affected route, the concrete changes and a link straight back into Routebase. Set one up under Settings → Messaging, which Messaging describes.
Related
- Incidents — what opens when downtime persists
- Monitors — the checks your rules evaluate
- Schema Drift — the drift severities the Schema Drift alert type keys on
- Contract Drift — where the Contract Drift Watch policy comes from
- Messaging — sending alerts to Slack or Microsoft Teams
- Maintenance Windows — muting alerts during planned work