

Diagrams
Routebase renders Mermaid diagrams everywhere documentation is written, with no plugin, no external service and no styling work. Every diagram is drawn in your portal's own colors and fonts, in light and dark mode, automatically.
This page covers where diagrams render, how to add them and how theming and per-diagram styling work. For the diagram block inside the page editor, with its split view, templates and error hints, see Authoring Pages.
Where diagrams render
- Documentation pages render diagrams in the editor as a live preview, in the portal preview and on the published portal.
- The API reference supports Mermaid in endpoint descriptions and section descriptions, so a sequence diagram can sit right next to the endpoint it explains.
- Inside the app, endpoint and folder descriptions in the API Designer render diagrams wherever they are shown.
Readers never need anything installed. Diagrams render client-side in the browser, and the rendering library is only loaded on pages that actually contain one.
Adding a diagram
In the page editor, type / and choose Mermaid Diagram. Pick Sequence Diagram, ER Diagram or State Diagram instead to start from a worked template. The block shows the source on the left and a live preview on the right, and syntax help and templates sit in the block's toolbar. Details in Authoring Pages → Diagrams.
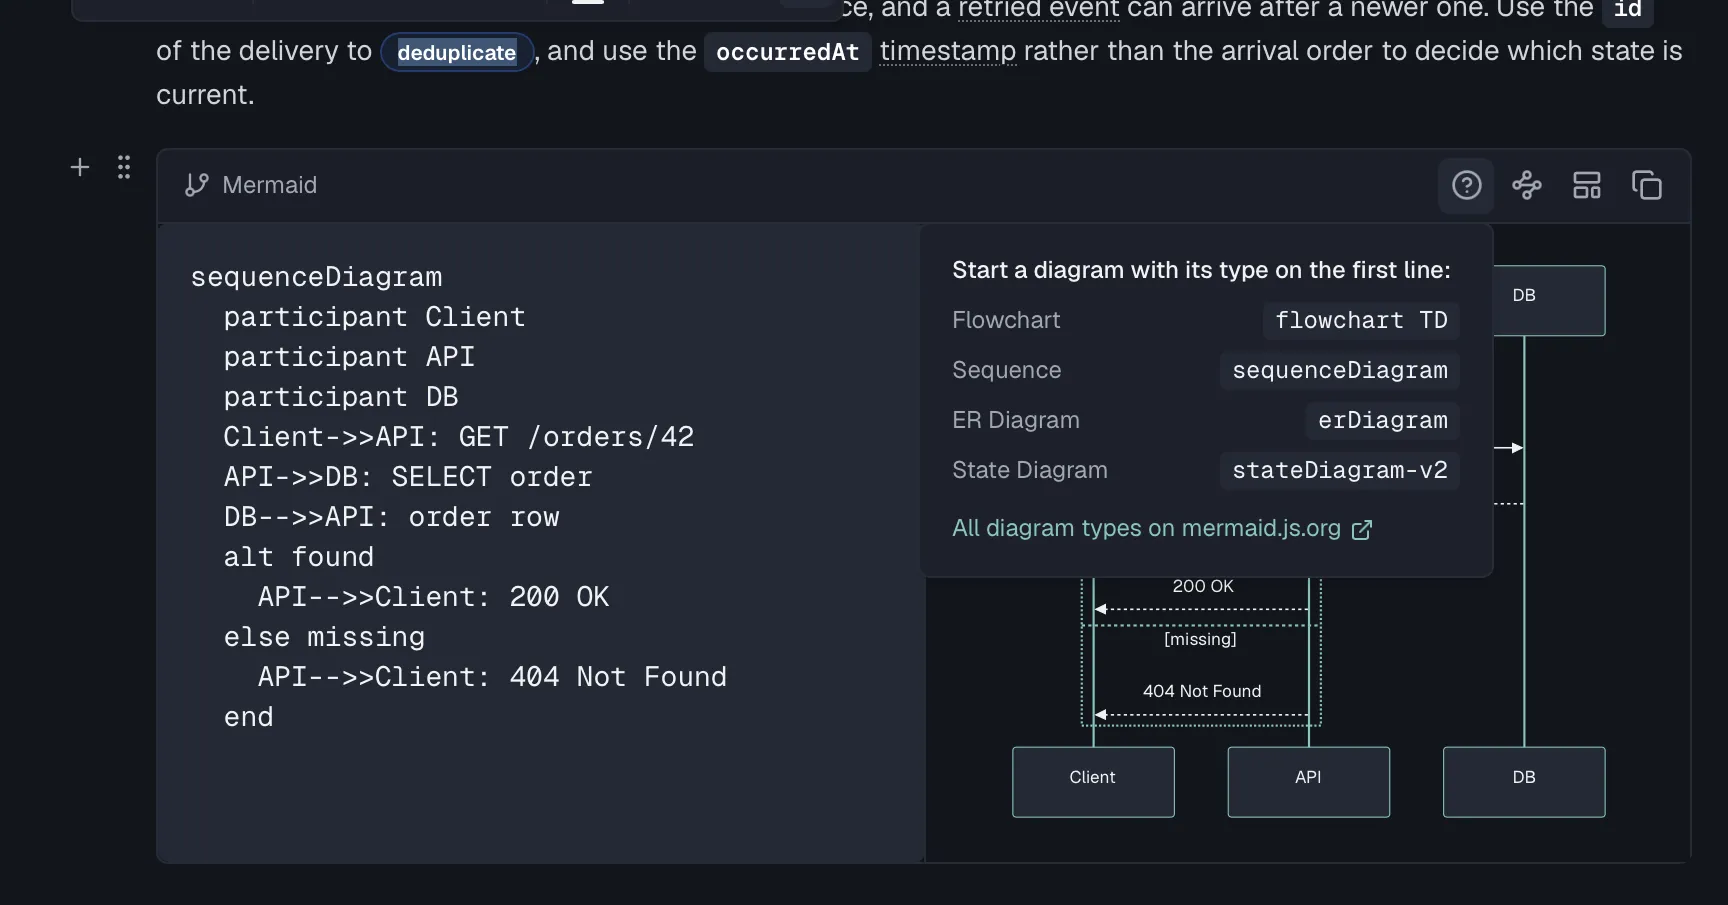
In Markdown, a diagram is a fenced code block with the mermaid language tag. The same syntax works in the editor's Markdown mode, in descriptions in the API Designer and in content written through the MCP tools and routebase docs push:
```mermaid
flowchart LR
  Client -- "POST /orders" --> API
  API --> Queue[(Queue)]
  Queue --> Worker
```
That block renders as:
flowchart LR
  Client -- "POST /orders" --> API
  API --> Queue[(Queue)]
  Queue --> Worker
All Mermaid diagram types work, including flowcharts, sequence diagrams, ER diagrams, state diagrams, class diagrams, pie charts, Gantt charts, mindmaps, timelines and the rest of what mermaid.js.org documents.
Generating diagrams from your API
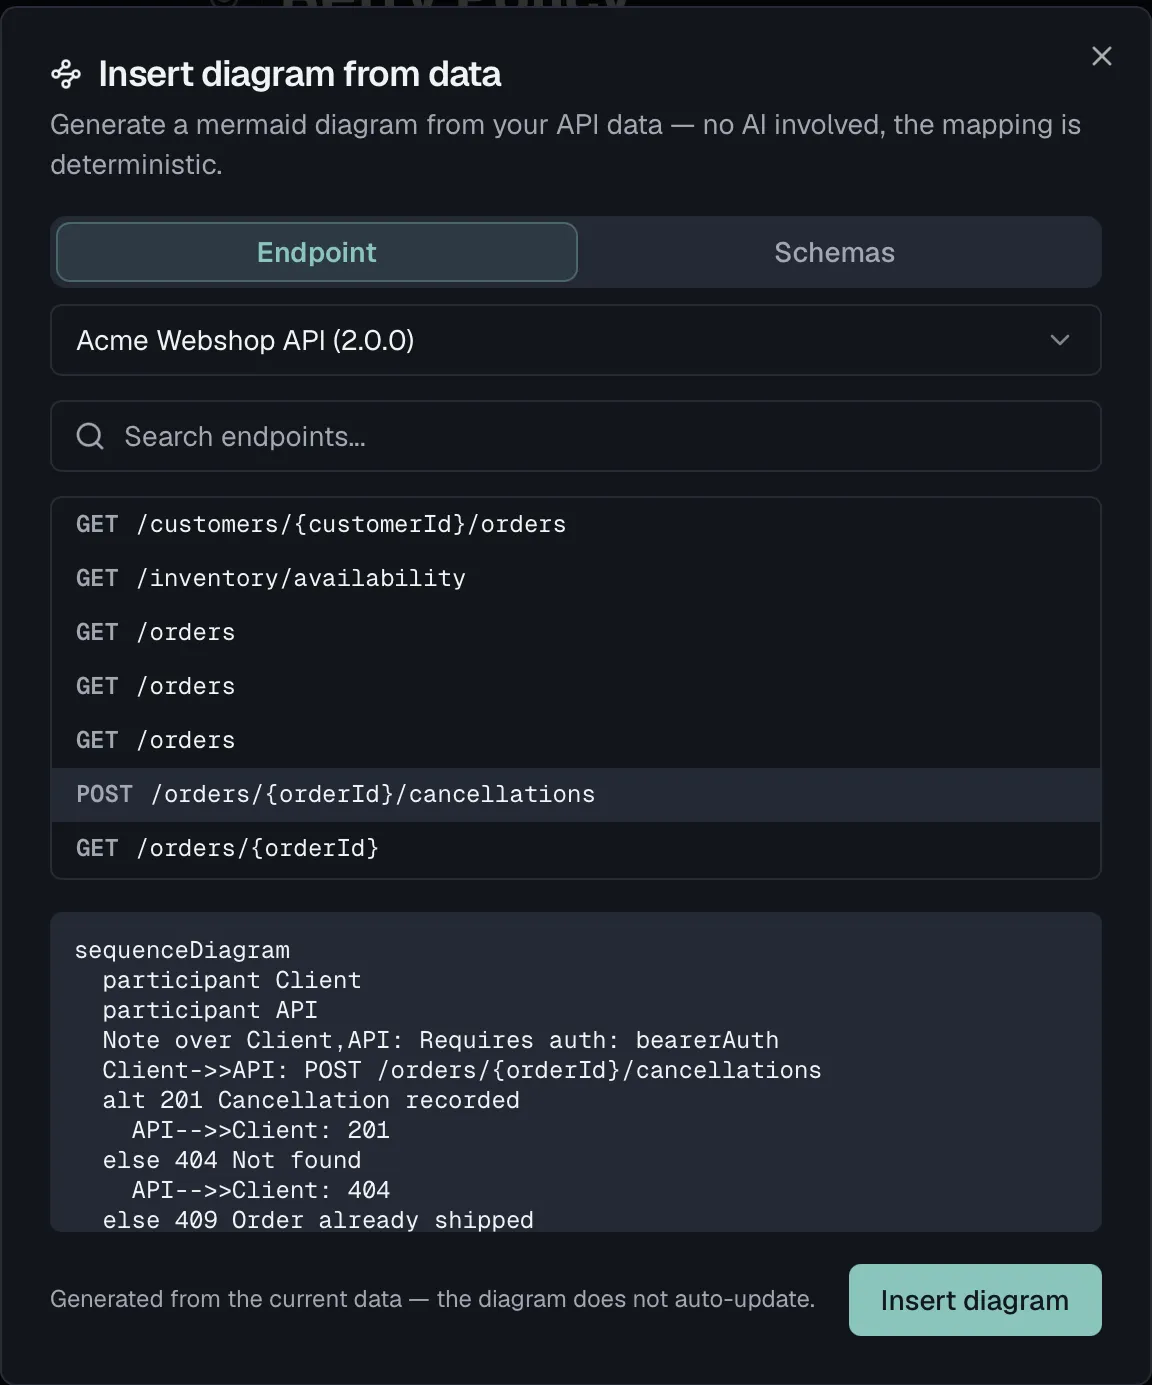
The Diagram from API Data slash command (also reachable from any Mermaid block's toolbar) writes the diagram source for you, from data Routebase already has:
- Endpoint turns an endpoint you pick into a sequence diagram of its request/response flow.
- Schemas turns one or more schemas into an ER diagram of their fields and relations.
- Dependencies turns a root service from your Service Catalog into a flowchart of its dependency graph, with a selectable depth.
The result is an ordinary Mermaid block. The generated source is yours to edit, and it does not update by itself when the API changes, so regenerate it when it should.
Diagrams match your branding
Diagrams are not skinned with a generic diagram theme. At render time they pick up the portal's active design tokens, which are the same ones your theme and brand colors define:
- Colors for node fills, borders, edge lines and label backgrounds come from your portal theme. Node borders use your primary color.
- Typography follows your portal's body font rather than a diagram-library default.
- Light and dark both work, because diagrams re-render when a reader flips the portal's theme toggle.
There is nothing to configure and nothing to keep in sync. Change your portal's brand color and every diagram follows on the next portal build. Inside the app, the same diagrams follow the app theme instead, so each surface matches its surroundings.
Styling an individual diagram
For deliberate emphasis, such as highlighting one node in a flow or coloring states by meaning, use Mermaid's own styling syntax, which is part of the diagram source and travels with it:
flowchart LR
  A[Request] --> B{Valid?}
  B -- yes --> C[Process]
  B -- no --> D[Reject]
  style D fill:#7f1d1d,stroke:#ef4444,color:#fecaca
  classDef done fill:#14532d,stroke:#22c55e,color:#dcfce7
  class C done
Two things deliberately do not work. Mermaid's %%{init: …}%% directives and YAML frontmatter config: blocks are ignored, because Routebase renders diagrams with a hardened security configuration that disables per-diagram config injection. Colors set with style and classDef are the supported way to deviate from the theme.
Portal-wide adjustments
If you want to restyle diagrams across the whole portal, for example with a different container background, use the Custom CSS card described in Branding & Appearance. Every diagram sits in a .docs-mermaid container with the rendered SVG in .docs-mermaid-svg inside it, so the frame, spacing and background are one selector away. The colors inside a diagram are embedded in its SVG and are better changed through your theme's brand colors than through CSS overrides.
When a diagram cannot render
- In the editor, a source that does not parse shows a Diagram syntax error panel with a plain-language hint above the raw Mermaid message. The page still saves.
- On the portal, an invalid diagram falls back to showing the diagram source as a readable code block, and so does a browser with JavaScript disabled. Nothing breaks the page.