

Dashboard
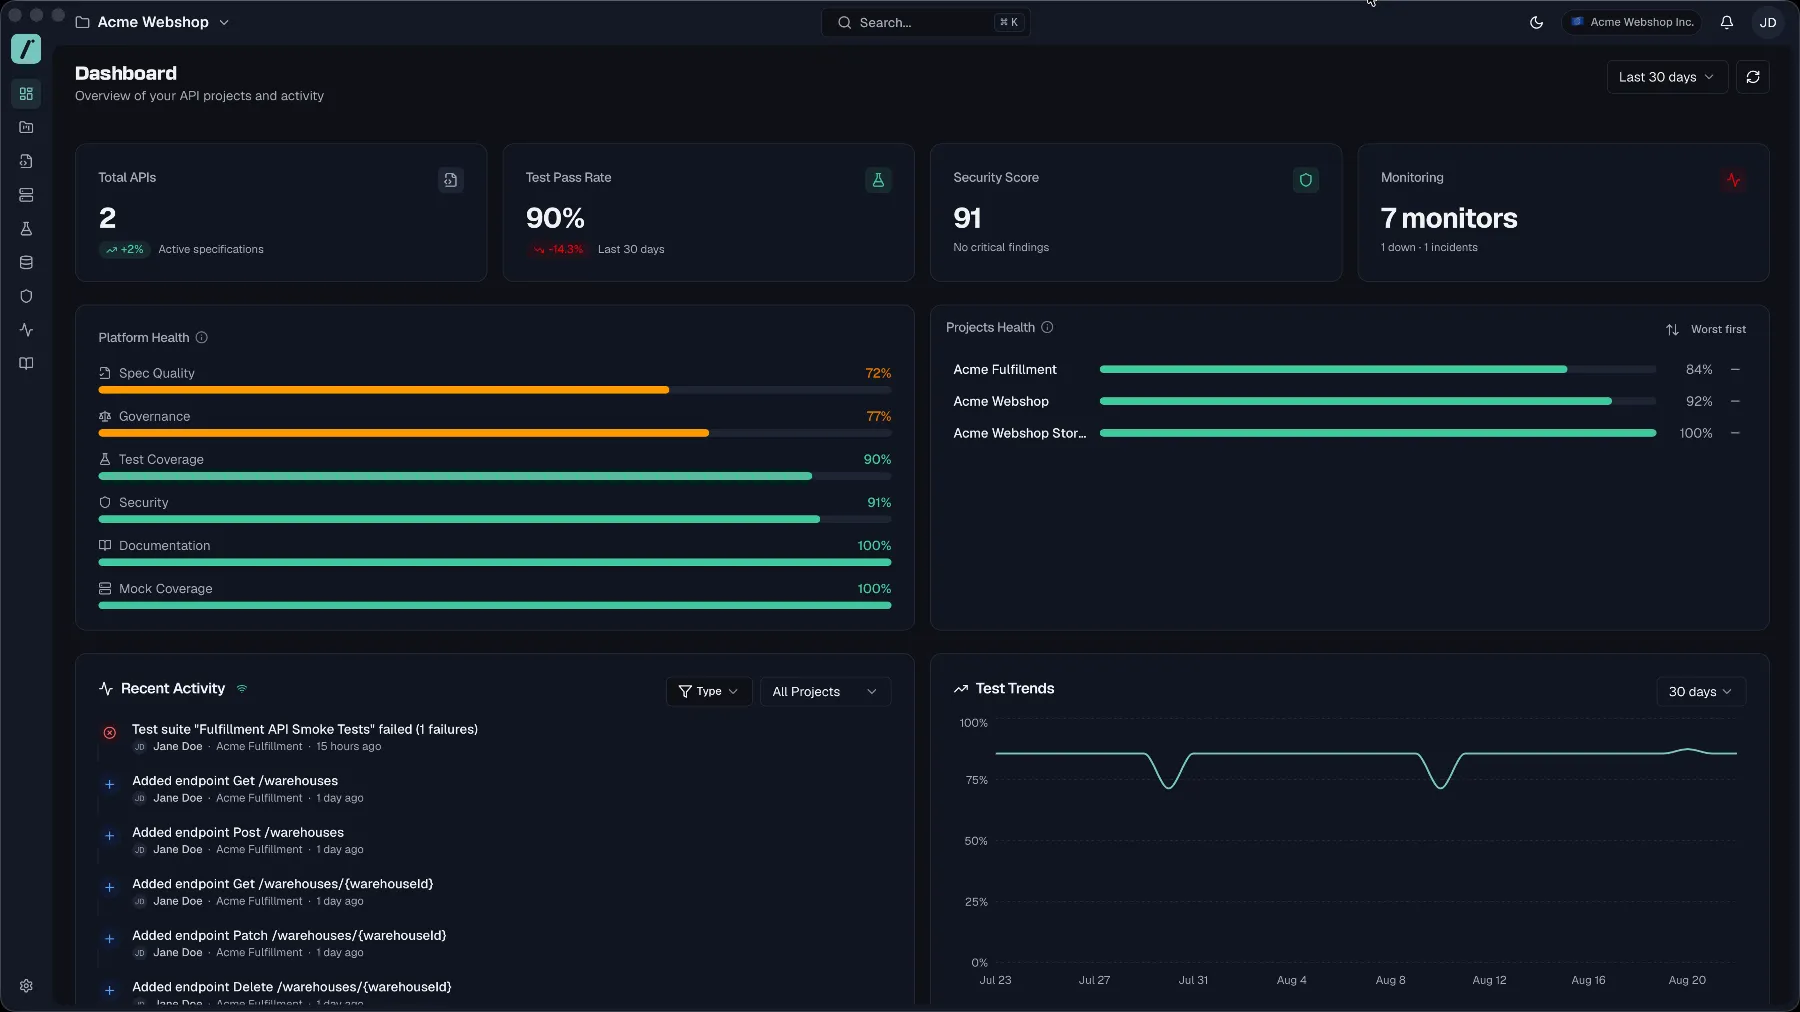
The Dashboard is your workspace home page, and it answers what needs attention today before you open anything else. It pulls the health of every project into one place, so a failing suite, a drifting contract or an open incident surfaces without you visiting each project in turn. Top-line KPIs, health scores, a live activity feed, test trends and quick actions all sit on that single page.
Header controls
| Control | What it does |
|---|---|
| Time range | Switch between Last 7 days, Last 30 days, and Last 90 days. Your choice is remembered as your default. |
| Refresh | Re-fetches every widget on the page. |
KPI cards
Four stat cards sit at the top. Each is clickable and takes you to the matching area of the app.
| Card | Shows | Click target |
|---|---|---|
| Total APIs | Number of active specifications, with a trend indicator. | Projects |
| Test Pass Rate | Pass rate over the last 30 days, color-coded — green at 90%+, amber at 70–89%, red below. | Test Runner |
| Security Score | Average security scan score, with a count of critical findings ("No critical findings" when clean). | Security |
| Monitoring | Number of monitors, plus how many are down and how many incidents are open ("All operational" when everything is fine). | Monitoring |
Platform Health
Platform Health breaks organization-wide quality into independent, individually scored dimensions, drawn as progress bars and sorted worst first so problems surface at the top. Green means 80%+, amber 50–79%, red below 50%. Hover a row for an explanation of what it measures.
| Dimension | What it measures |
|---|---|
| Governance | Compliance score across all specs — style guide, documentation, security and consistency, weighted into one number. |
| Security | Average security scan score across your projects. |
| Documentation | Share of documentation-hub pages that are published. |
| Active Mock Rules | Share of mock rules that are currently active. |
| Spec Quality | Style-guide linting score across all specs (errors, warnings, infos) — a subset of Governance, shown on its own. |
These are org-wide quality lenses, distinct from the per-project operational health below. The test pass rate has its own KPI card above, so Platform Health doesn't repeat it. To see how many endpoints your tests and mocks cover, open a project and check the API Coverage section of its overview.
Projects Health
Projects Health lists your projects with an operational health score each. The bar per project combines test pass rate, documentation, security, endpoint completeness and mocks. A trend arrow next to each score shows whether the project is improving, declining, or steady.
- The sort toggle switches between Worst first and Best first.
- Click a project to open it; View all projects takes you to the full project list.
Create with AI inside Routebase
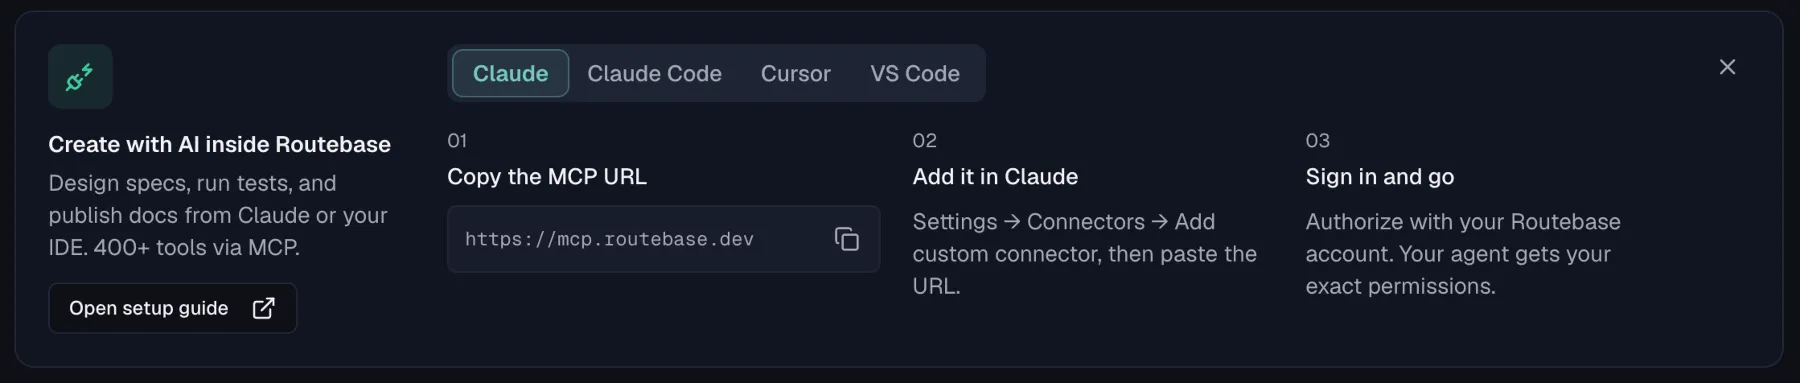
Below the health widgets, before the activity feed, sits the MCP connection card, which reads "Design specs, run tests, and publish docs from Claude or your IDE." It is the shortest path to using Routebase from an agent, and it gives you a connection scoped to this workspace rather than a generic setup.
It has a tab per client:
- Claude — three steps: copy the MCP URL, add it under Settings → Connectors → Add custom connector, then authorize with your Routebase account. Your agent gets your exact permissions, no more.
- IDE clients — the same idea, but they authenticate with an API key instead. Step one creates one for you; if your role can't create keys, the card says to ask an org admin.
The URL it hands you already points at your organization's region, which removes the most common setup mistake. Dismiss the card once you're connected and it stays gone.
Full walkthrough: MCP Quickstart.
Recent Activity
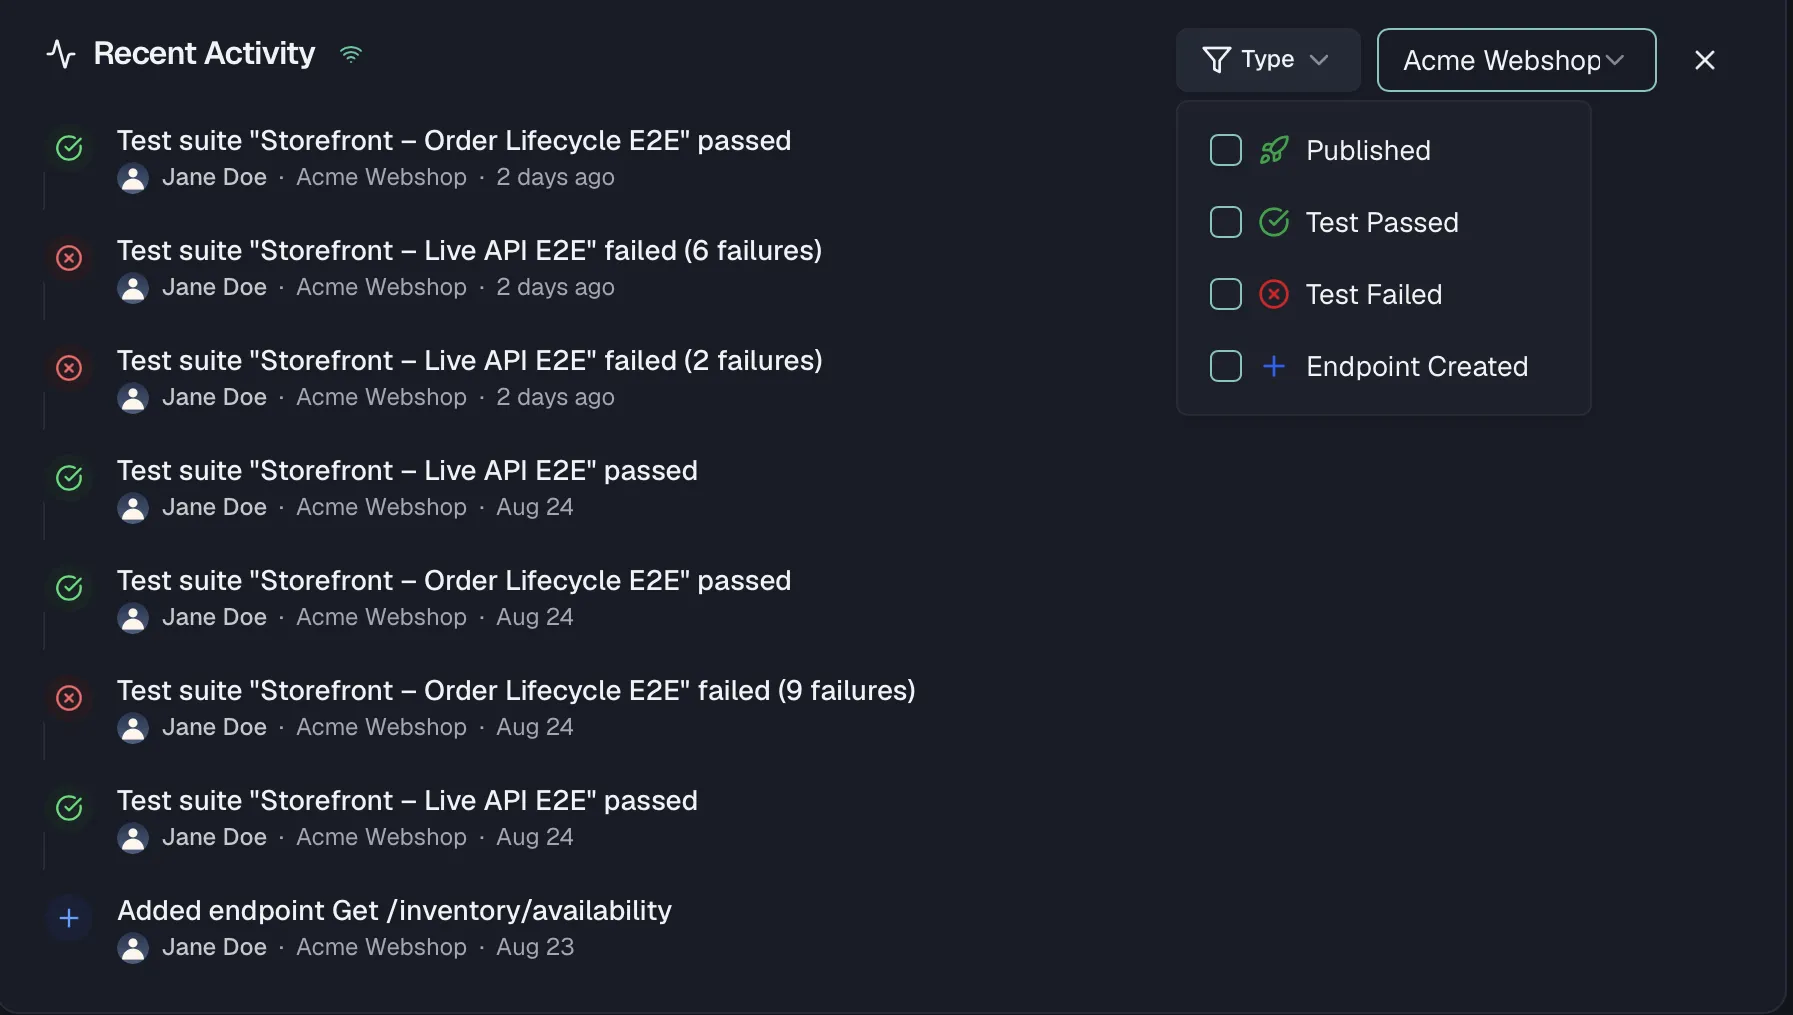
The Recent Activity feed shows what's happening across your organization. Each entry carries a title, the user who triggered it, the project and a relative timestamp. Clicking an entry jumps to the relevant place in the app.
The feed updates in real time. The small indicator next to the title shows "Real-time updates active" when connected, and new activity also appears as a toast notification.
Filter the feed with the controls in the card header:
- Type — a multi-select of activity types, offering Published, Test Passed, Test Failed and Endpoint Created.
- Project — limit the feed to a single project (All Projects by default).
- The X button clears all active filters.
When there is nothing to show yet, the feed reads "Activity will appear here when you publish versions, run tests, or add endpoints."
Test Trends
Test Trends charts your test pass rate over time as a line chart, with its own time range selector (7 days, 30 days, 90 days). Use it to spot regressions early, because a dipping line usually shows up before anyone files a bug.
Quick Actions
A row of shortcuts for the most common tasks:
| Action | What it does |
|---|---|
| New Project | Opens the Create Project dialog. |
| New Spec | Creates an API specification in one of your projects (disabled until you have a project — "Create a project first"). |
| Run Tests | Opens the Test Runner. |
| View Docs | Opens this documentation in a new tab. |
The empty dashboard
A brand-new workspace shows a "Welcome to Routebase" screen instead of widgets, with two ways to start. The Create with AI inside Routebase card sits below them deliberately, because a fresh workspace is exactly where connecting an agent pays off most.
The two starting points are:
- Create Project — start fresh with a new API project.
- Import OpenAPI — import an existing specification. The import dialog walks you through two phases:
- Pick an OpenAPI file (
.yaml,.yml, or.json) in the Upload phase. This dialog reads OpenAPI only, so Postman and Insomnia exports go through the specification wizard inside a project. - Check the Review phase, where Routebase pre-fills the project name, spec name, description and version from the file, and derives environments from the spec's servers. All of them stay editable before import, and the import options below apply as well. Click Import and you land directly in the API Designer with your spec loaded.
- Pick an OpenAPI file (
Import options
| Option | Default | Effect |
|---|---|---|
| Convert to OpenAPI 3.1 | off | Only offered when the file is 3.0. Upgrades nullable syntax and exclusive min/max to the 3.1 form. |
| Organize endpoints by tags | on | Auto-creates folders from the OpenAPI tags and groups endpoints into them. |
| Shorten schema names | off | Uses only the last dot-segment of a schema name — Acme.Orders.OrderLine becomes OrderLine — where that short name is unique in the spec. |
Turning on Shorten schema names reveals one more choice, and it is the consequential one for specs generated from .NET or Java:
- Keep original names internally (default) — the full namespaced names are stored alongside the short ones. Recommended if you will re-import the file or diff against it later.
- Discard namespaces permanently — the original names are not kept. Later comparisons against the source file report every schema as renamed.
Related
- Getting Started — from sign-up to your first spec
- Projects — creating and organizing projects
- Global Search — find anything from anywhere with ⌘K
- Monitoring Overview — the monitors behind the Monitoring card
- Security Overview — the scans behind the Security Score