

Monitors
A monitor is a scheduled HTTP health check against one target, which is either a URL you type in or an endpoint from your spec. Each run is recorded as a check with full timing details, and the results feed the uptime stats, alerts and incidents across the Monitoring area.
The Monitors page
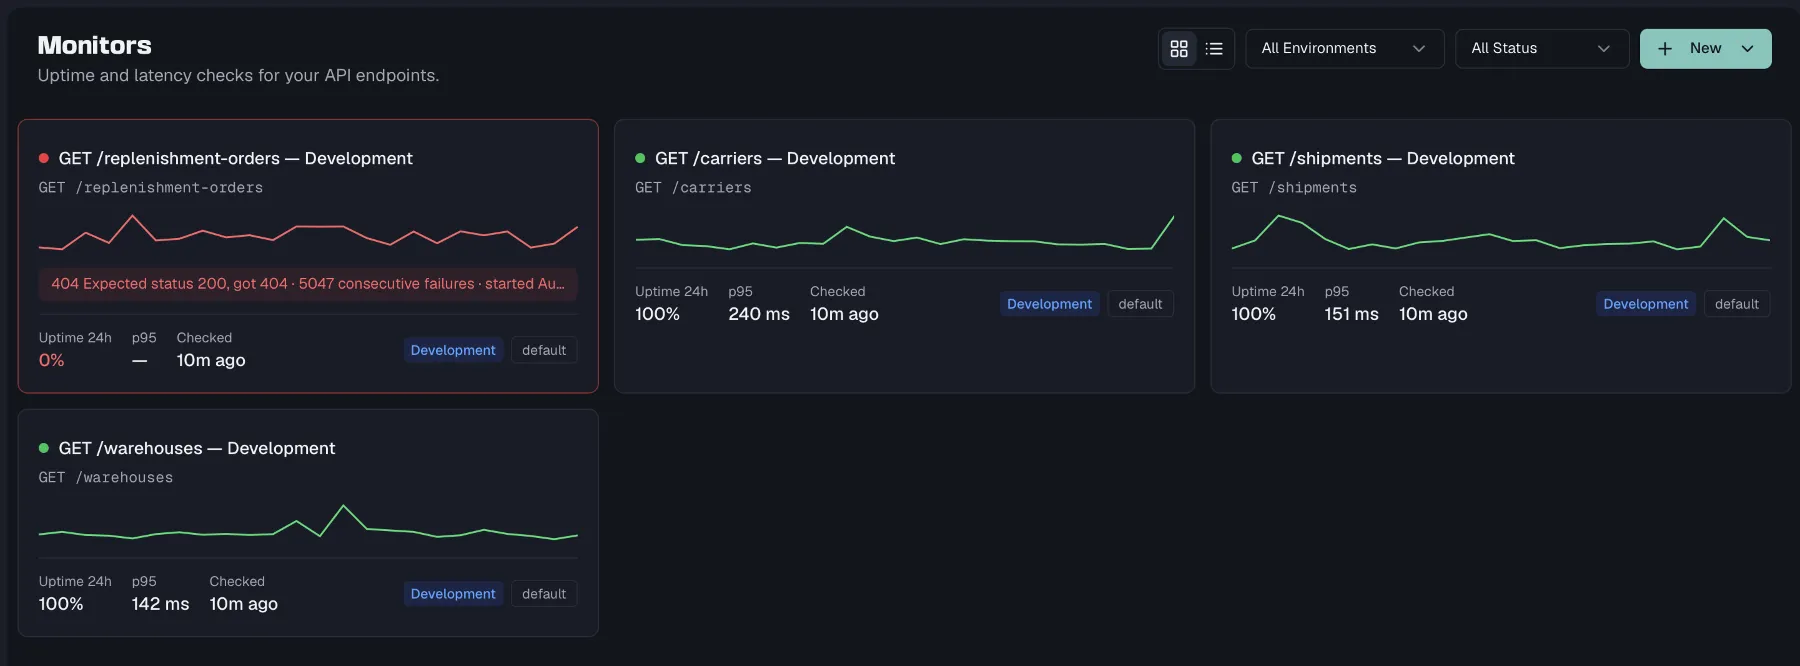
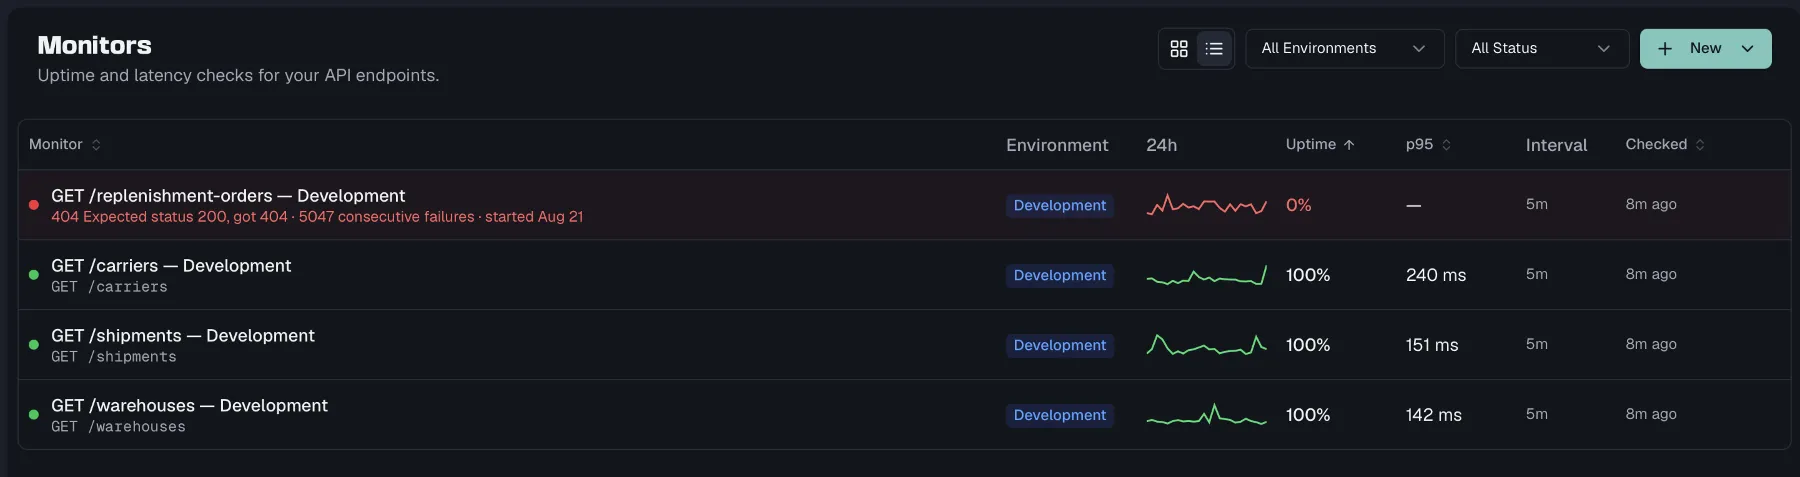
Open Monitoring → Monitors to see every monitor in the project, in one of two views you switch between in the page header:
- Grid gives one card per monitor with its status dot, name, method and path, a 24h response-time sparkline, and the figures that matter at a glance. Those are uptime over 24 hours, p95 response time, and when it was last checked. A down or degraded monitor tints its card and carries a one-line failure summary reading "503 Service unavailable · 4 consecutive failures · started 12m ago". Paused monitors are dashed and dimmed, and they say "Paused · no checks running" instead of showing a chart.
- Table gives the same figures built for comparing and ranking. Monitor, Uptime, p95 and Checked are click-sortable, and clicking again reverses the order. The default order is status priority, so problems sort to the top and paused monitors to the bottom. The sparkline rides along in a compact 24h column.
The sparkline plots one point per hour. Hours without checks leave a gap in the line rather than a straight segment through them, so a monitoring outage does not read as a flat response time.
Two filters narrow the list. The status filter offers All Status, Up, Down, Degraded, Waiting for parameters, Waiting for deployment and Unknown. See monitor states for what the two waiting states mean. When the project has environments, an All Environments filter sits next to it, where you pick an environment to show only its monitors, or Not linked for monitors with no environment.
Use the row or card menu, which appears on hover, for quick actions:
- Run Check triggers a check immediately, without waiting for the next interval.
- Edit changes any part of the configuration.
- Disable and Enable pause or resume checking without deleting anything.
- Delete removes the monitor and its history for good, and it asks for confirmation first.
All of these require the monitoring:write permission, so Members see the list but no editing controls.
The monitor tree
While you are on the Monitors page, the sidebar shows an inline tree of all monitors grouped by environment → API spec → monitor. Each group shows an aggregated status dot and an up-against-total count. Disabled monitors are dimmed, and a wrench icon marks anything currently in maintenance. A search box and status filter sit above the tree.
Right-click any level of the tree to Schedule Maintenance or Assign Alert Policy at that scope, whether that level is an environment, a spec or a single monitor.
Creating a single monitor
- On the Monitors page, click New and choose Single Monitor.
- Fill in the dialog and click Create Monitor.
| Field | Notes |
|---|---|
| Name | A label for the monitor, such as User API Health. |
| Target URL | An absolute URL such as https://api.example.com/health, or a variable template like {{baseUrl}}/health resolved from your environment variables. Anything else is rejected with an inline error. |
| HTTP Method | One of GET, POST, PUT, PATCH, DELETE, HEAD and OPTIONS. |
| Expected Status | The status code that counts as healthy. It defaults to 200 and accepts 100 to 599. |
| Check Interval | Preset buttons offering 30s, 1m, 5m, 15m, 30m and 1h. The default is 5m. |
| Timeout (seconds) | How long to wait before the check fails. The default is 30 and the maximum is 120. |
| Schema Validation | One of Off, Warn and Strict, defaulting to Warn. See Schema Drift. |
| Environment | Optional. Link the monitor to a project environment so its variables and auth are applied to every check. Defaults to None. |
| Headers | Optional request headers as key and value pairs. |
| Request Body | Shown for methods that allow a body, and hidden for GET, HEAD and OPTIONS. |
When you pick an Environment, a hint confirms the automatic behavior with "Variables and auth of this environment are applied to checks automatically (Basic, Bearer, API Key, OAuth2, JWT). A static header with the same name takes precedence." A linked environment therefore resolves any {{variable}} in the target URL and signs each check with the environment's configured auth. The exception is a header you set yourself under the same name, in which case your static header wins.
A monitor starts checking as soon as it is created. The pre-filled interval, timeout and schema-validation values come from the project defaults in Monitoring → Settings.
You can also create a monitor straight from the API Designer. Right-click an endpoint in the tree and choose Create Monitor. The dialog opens pre-filled with the endpoint's method, a {{baseUrl}} target URL, and the endpoint link that enables schema validation.
Generate from Spec
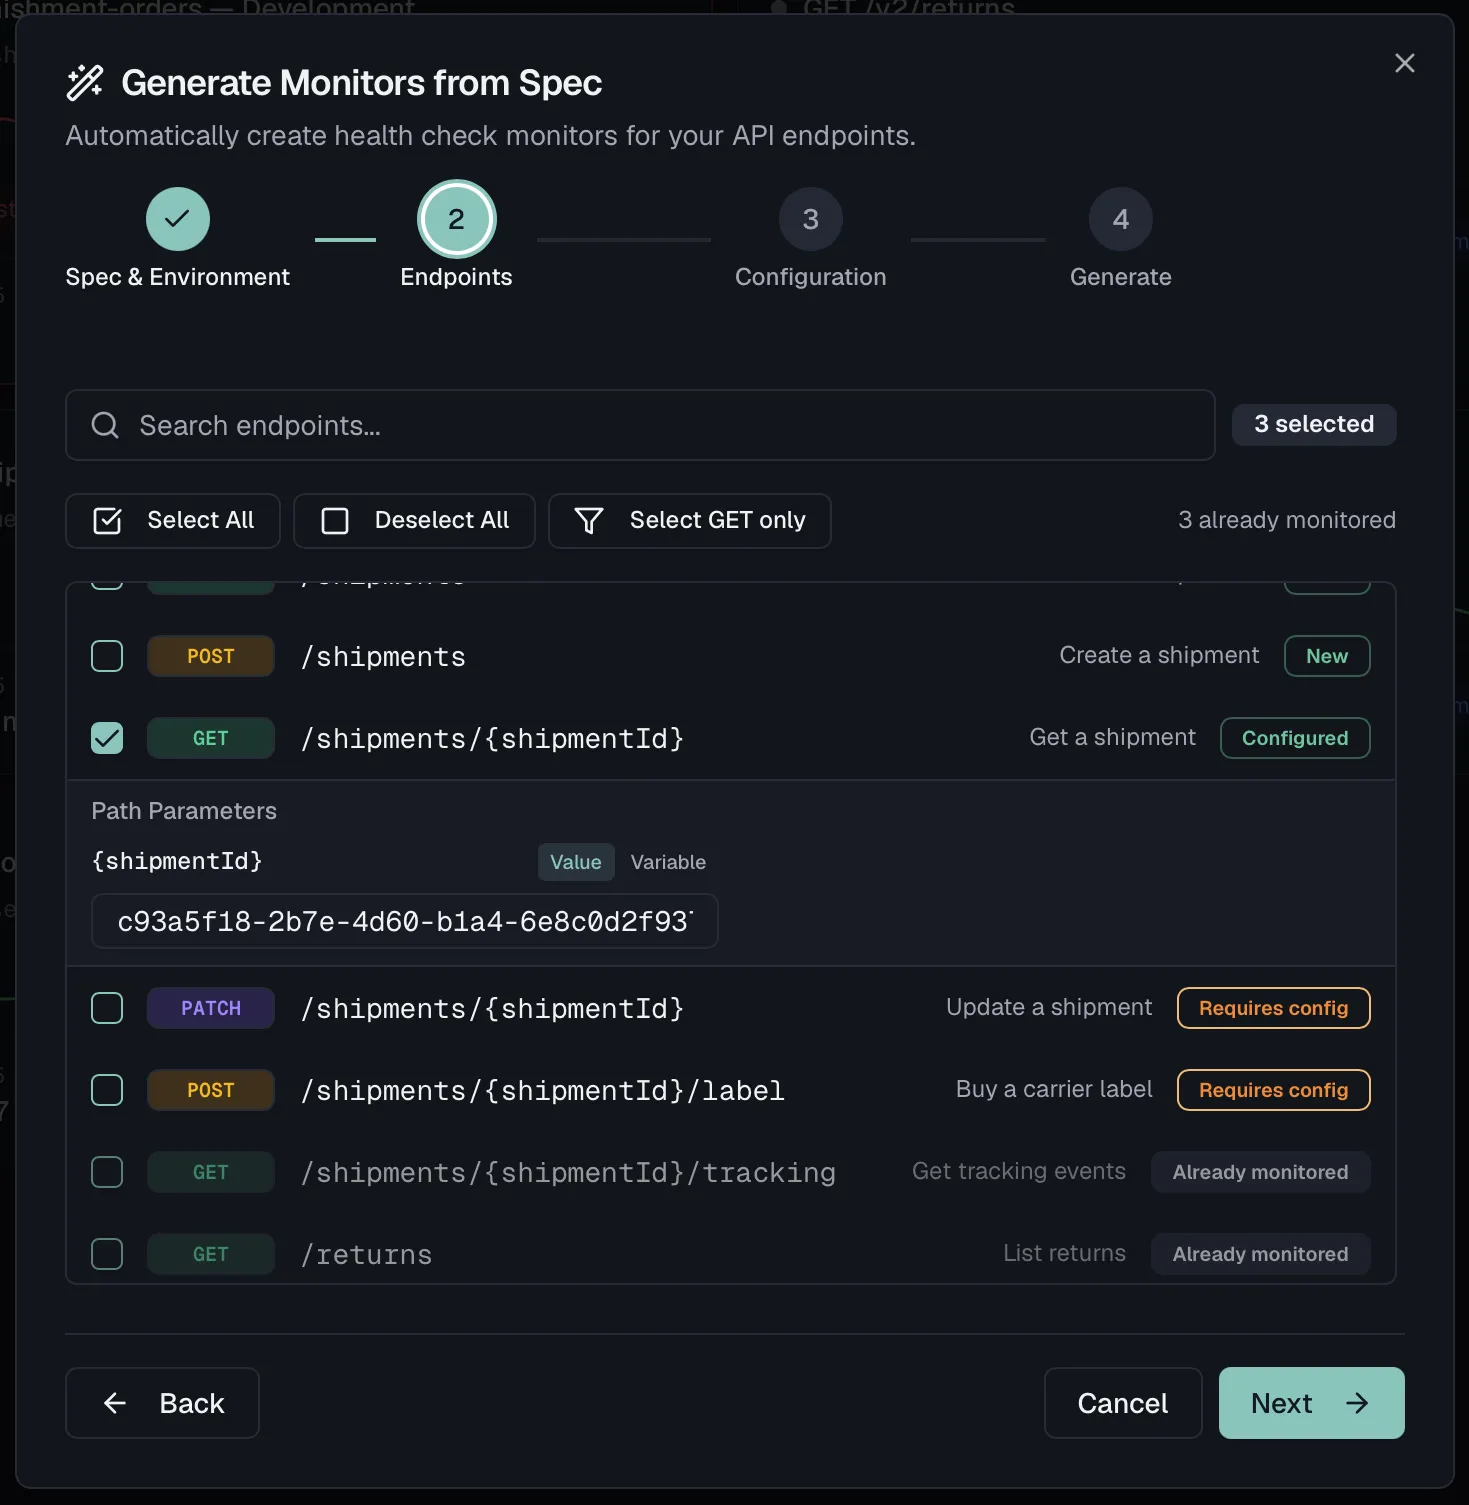
To cover an API quickly, choose New → Generate from Spec. A four-step wizard walks you through it:
- Under Spec & Environment, pick the API specification, a spec version, and the environment to monitor. Leave the version on Latest published to always track the most recent published version, or pin a specific one, which versioning explains. The environment's base URL is previewed, and if none is configured you are warned that monitors will use path-only URLs.
- Under Endpoints, select which endpoints get a monitor. The bulk buttons are Select All, Deselect All and Select GET only. Each endpoint is badged New, Already monitored so it will be skipped, or Requires config, and endpoints with path parameters ask you for a value or a
{{variable}}per parameter. - Under Configuration, set Global Defaults for the batch, which are the check interval of
1m,5m,15mor30m, the timeout, and the schema-validation mode. The preview table shows every selected endpoint, and expanding a row lets you override its Name, Expected Status or Interval individually. Endpoints without a response schema automatically get schema validationoff. - Under Confirmation, review the summary and click Generate Monitors. The result reports how many monitors were created and how many were skipped, plus any warnings, so re-running the wizard only fills the gaps.
Or: watch the whole API for drift
When the point of the exercise is contract validation rather than uptime, there is a shorter path. Watch this API for drift provisions endpoint-linked monitors with schema validation for a whole spec in one environment from a single dialog. You pick the environment, the validation mode and how sharp the alerts should be, then confirm. It is reachable from the API Designer's toolbar ⋯ menu under Watch for drift, and from the empty state of Monitoring → Contract Drift.
Like the wizard it is idempotent, so existing monitors are updated rather than duplicated. It is also reversible without losing anything, because disabling turns validation off and leaves the monitors running as uptime checks. See Contract Drift.
Monitor detail
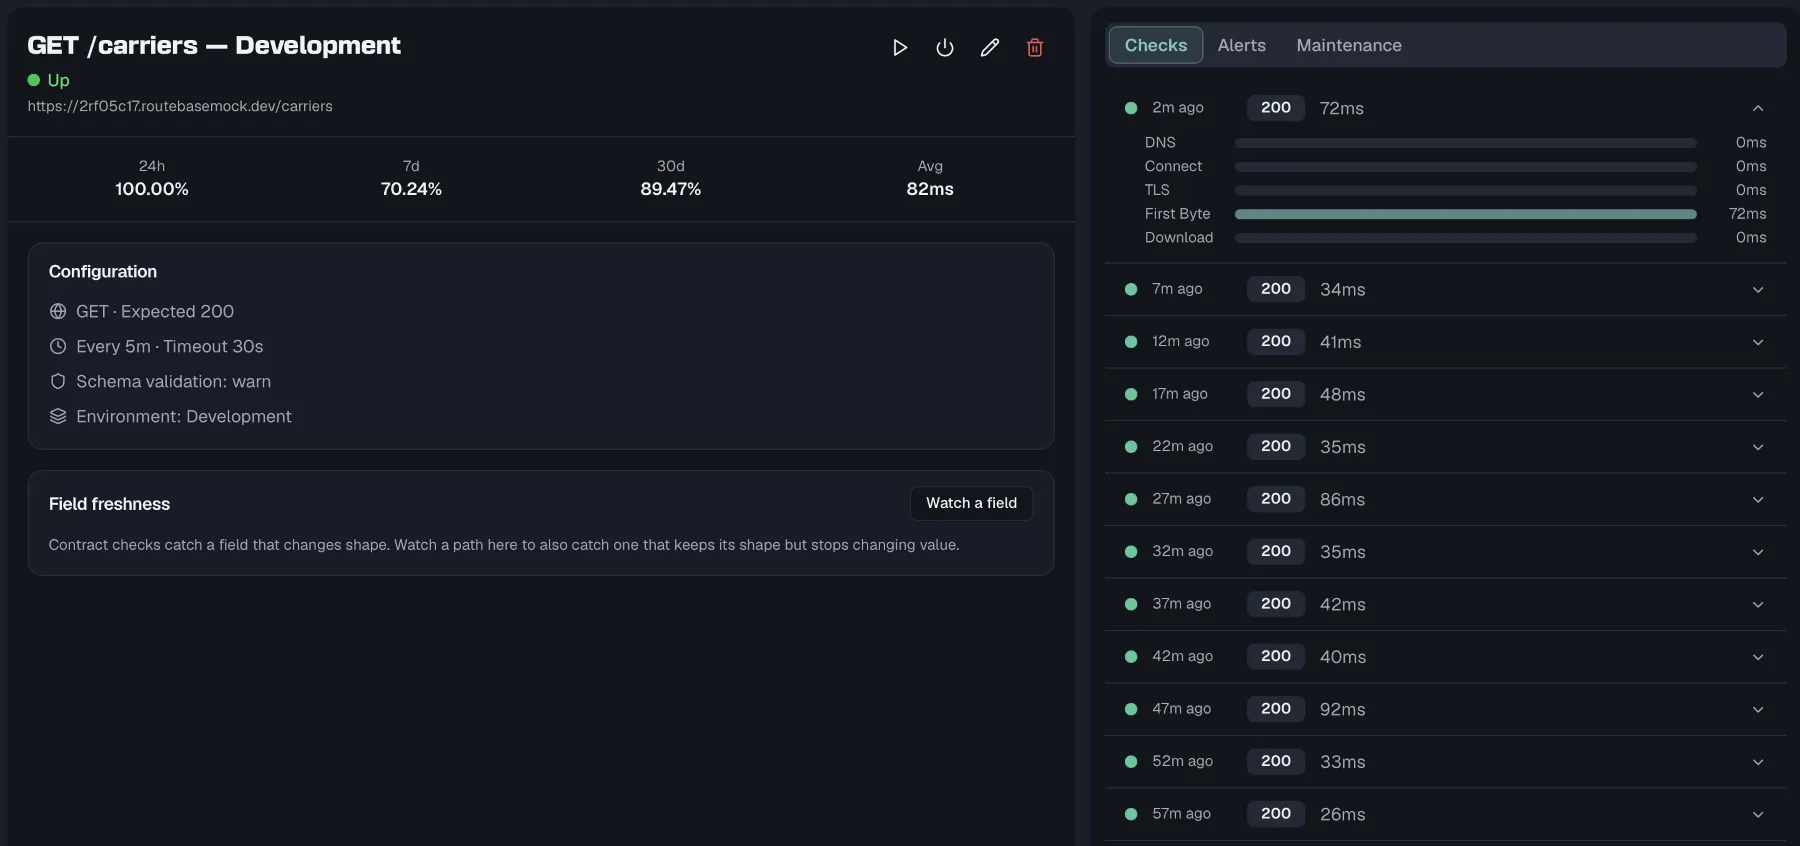
Click a monitor to open its detail page. The header shows the name, current status, target URL, and the quick actions Run Check, Enable or Disable, Edit and Delete. If the monitor is linked to an endpoint that has since been deleted, a warning banner reads "This monitor is linked to a deleted endpoint. Schema validation may fail."
Below the header you get uptime over 24h, 7d and 30d plus the average response time. A Configuration card summarizes method, expected status, interval, timeout, schema-validation mode, environment and the linked spec.
For a monitor with schema validation on, the card also names the contract it is checking against, reading "Validated against 2.1.0 (environment pin)", or "(latest published)" where the environment pins nothing. If the pin has fallen behind what is published, the line turns amber and offers a Re-pin button, because until then drift against the newer contract stays invisible. See Contract Drift.
The right panel has three tabs:
- Checks holds the recent check timeline. Each entry shows whether it passed, the status code and the response time, and checks that drifted from the contract carry a drift badge with the number of deviations. Expand an entry for the per-phase timing breakdown across DNS, Connect, TLS, First Byte and Download, plus the error message for failed checks. A failure that a status code cannot express carries a reason badge, described below.
- Alerts holds the monitor's own alert rules and firing history. See Alert Policies.
- Maintenance holds maintenance windows scoped to this monitor. See Maintenance Windows.
Why a check failed
Every failed check records a structured reason, and the ones a status code cannot express get a badge in the timeline:
| Badge | What happened |
|---|---|
| Auth failure | The credential is the problem rather than the service. Either the environment's auth could not be resolved at all, so the request never left the building, or the target answered 401 or 403. A rotated or expired token lands here instead of looking like an outage. |
| Timeout | Nobody answered within the monitor's timeout. |
| Connection error | No answer for a transport reason such as DNS, TLS, a refused connection or a malformed URL. |
| Schema drift | The endpoint answered exactly as expected and the body then failed error-severity validation in Strict mode. The only failure that was successful on the wire. |
| Waiting for deployment | The endpoint has never answered yet. Informative rather than alarming. |
A plain wrong status code gets no badge, because the status-code badge right next to it already says 500 and a second chip repeating that in words is noise. For the same reason a transport failure shows no status code at all rather than a bare 0.
All of these count against uptime and the error-rate window except waiting for deployment, which is excluded from every health figure. A monitor that correctly waits for its service must not report 0 % uptime, and its checks must not fill the window that would then fire an alert on recovery.
Field freshness
Contract checks catch a field that changes shape. They cannot catch one that keeps its shape and stops changing value, such as a lastUpdatedAt frozen since Tuesday, a price feed that went stale, or a counter that stopped counting. Every one of those passes schema validation perfectly.
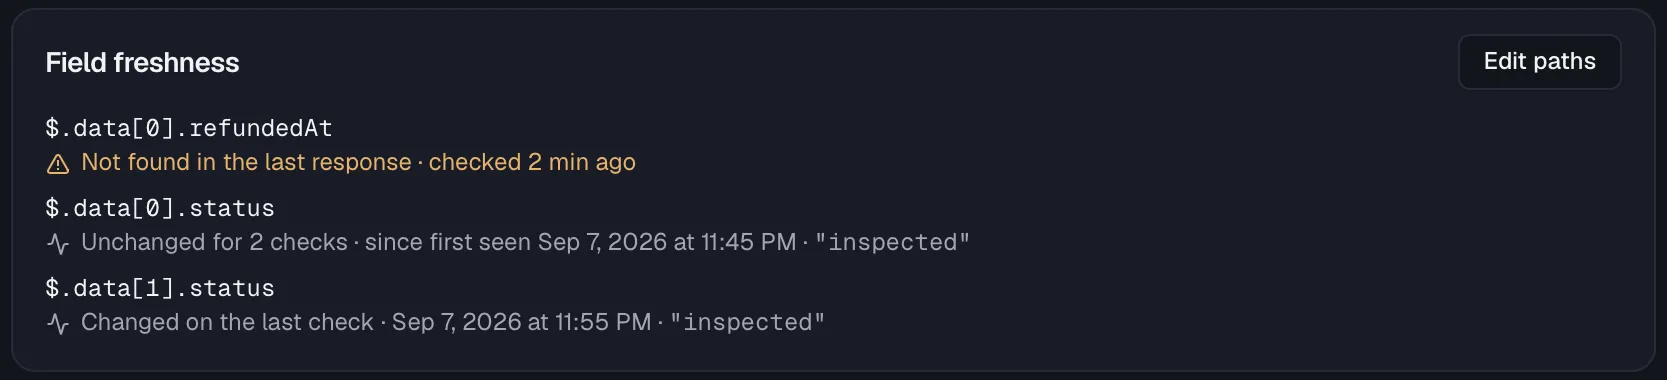
The Field freshness card on the monitor's detail page watches specific values instead. Click Watch a field, enter one JSONPath per line such as $.data.updatedAt or $.items[0].price, and save. A monitor takes up to 20 paths. What you save is a set rather than a list of edits, so paths you keep hold on to their history, and removing a line deletes what is known about that field.
Each watched path then reports what the checks have actually seen:
| State | Meaning |
|---|---|
| No check has read this path yet | The watch is new, or no check has succeeded since. Nothing has been measured. |
| First value recorded | Seen exactly once — there is nothing to compare it against yet. |
| Changed on the last check | The value moved on the most recent reading. |
| Unchanged for 47 checks · last changed … | It moved once, and has stood still since. |
| Unchanged for 47 checks · since first seen … | It has never moved while we have been looking. |
| Not found in the last response | The path did not resolve. This is the only state shown as a warning, because it means the watch is measuring nothing. |
There is deliberately no staleness threshold and no alert. A value unchanged for 200 checks may be a frozen feed or a perfectly correct constant, and only you know which. Inventing a cut-off would put a verdict on data Routebase cannot judge, so an unchanged value is shown neutrally rather than as a warning.
Two details make the numbers trustworthy. Freshness is read from the full response body rather than the 4 KB sample kept for triage, because a field past that cut would otherwise read as missing forever. It is also recorded whenever the server answered as expected, including on a Strict monitor whose check was failed by drift. A persistently drifting endpoint must not lose its freshness history exactly while someone is looking closely.
Related
- Monitoring Overview — the dashboard and how the pieces fit
- Schema Drift — what schema validation checks and how
- Contract Drift — watching a whole API, and triaging what drifts
- Coverage — tracking which endpoints have monitors
- Environments — the base URLs and variables monitors resolve against