

Contract Drift
Contract drift is what happens between two deploys. Your specification still promises one thing, and production has quietly started returning another. Nothing is down, every check is green, and the mismatch only surfaces when a consumer breaks.
Routebase watches for it continuously. Every monitor check that gets a response validates that response against the contract its environment is supposed to be serving. A deviation that keeps showing up becomes a drift event, which is a record with a first-seen date, an observation count, and a lifecycle you can acknowledge and close.
sequenceDiagram
    participant M as Monitor check
    participant A as Your API
    participant C as The contract
    participant D as Drift event

    Note over C: the version the environment pins —<br/>or the latest published one, if nothing is pinned

    M->>A: a request, on its schedule
    A-->>M: 200, with a body
    M->>C: validate the body against it

    alt the body matches
        C-->>M: no deviation
        M->>D: an open event resolves itself
    else the body deviates
        C-->>M: the deviating field paths
        M->>D: first sighting opens an event,<br/>later ones raise its count
    end
This guide covers the project-wide drift surface, which means switching drift watching on for a whole API, reading the Contract Drift page, and the triage detail behind a single event. For the per-monitor mechanics, see Schema Drift. That guide explains how a monitor gets a schema, what Warn and Strict do, and which change types exist.
Watch a whole API for drift
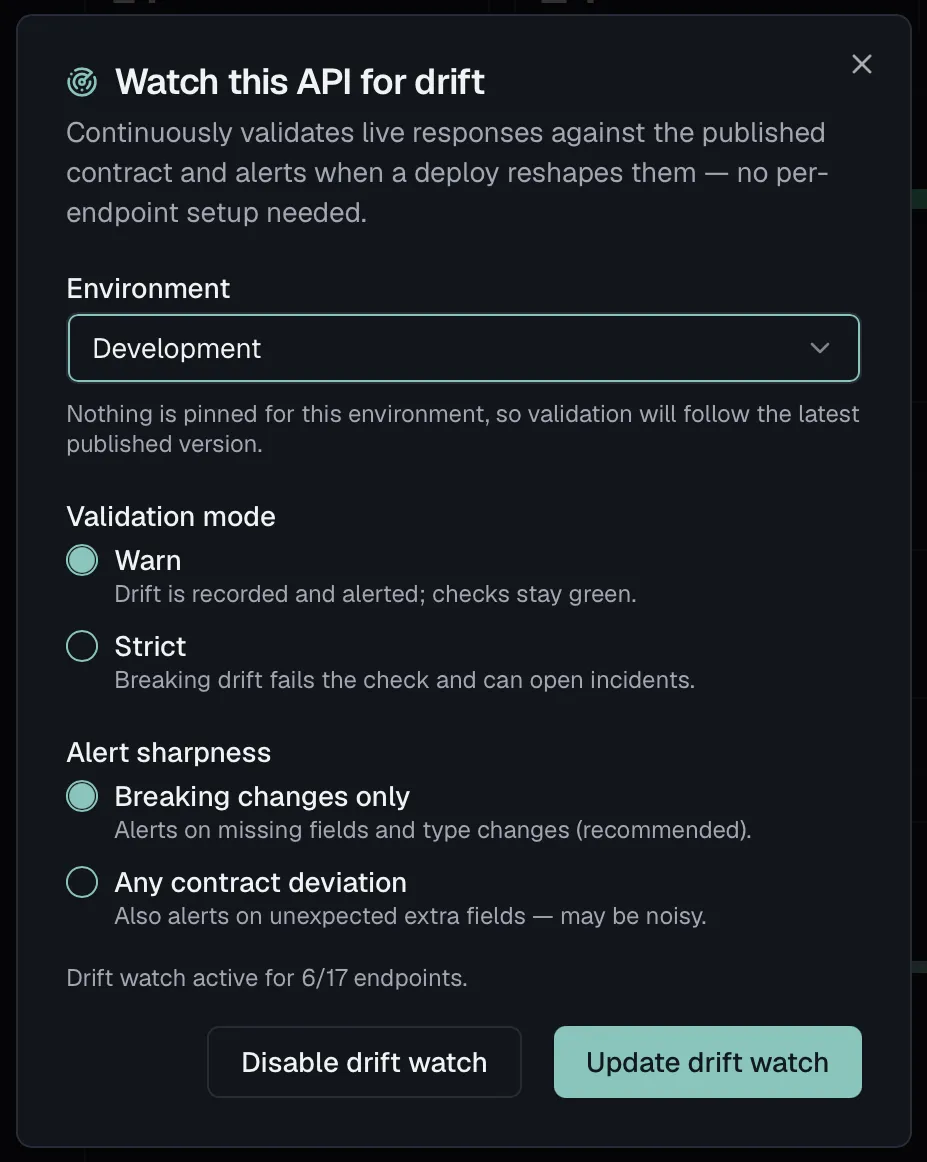
The turnkey path configures every endpoint of one spec in one environment at once, instead of setting up monitors endpoint by endpoint. It sits behind a single dialog called Watch this API for drift, which you reach from two places:
- In the API Designer, open the spec, then the toolbar's ⋯ menu labelled More actions and choose Watch for drift. The entry only appears with the monitoring:write permission.
- Under Monitoring → Contract Drift, the page's empty state offers the same dialog through its Watch for drift button while nothing in the project is watched yet.
| Field | Notes |
|---|---|
| API specification | Shown only when the dialog is opened without a spec context — from the Designer the current spec is already set. |
| Environment | Environments without a base URL are listed but disabled: monitors need somewhere to send the request. |
| Validation mode | Warn — drift is recorded and alerted, checks stay green. Strict — breaking drift fails the check and can open incidents. |
| Alert sharpness | Breaking changes only (recommended) — missing fields and type changes. Any contract deviation — also unexpected extra fields, which is noisier. See Alerting on drift. |
Before you commit, the dialog names the contract these monitors will check against. It reads "Will validate against 2.1.0 — the version this environment is pinned to", or it notes that nothing is pinned and validation will follow the latest published version. It also previews the scope, so you see how many endpoints will be watched and how many already have a monitor that will be updated.
The spec needs at least one published version. Without one the dialog refuses with "This specification has no published version yet. Publish it first to enable drift watch."
What enabling it does
Enable drift watch provisions an endpoint-linked monitor with schema validation for every endpoint of the spec, in the selected environment. It is idempotent, because existing monitors are reused and updated rather than duplicated, so you can re-run it after adding endpoints and only the gaps get filled. The result panel reports how many monitors were created, updated and skipped against the endpoint total, plus any warnings.
One line in that result deserves attention, and it reads waiting for a path parameter value. A monitor whose target URL still contains an unresolved {id} has nothing meaningful to request, so it runs no checks and can report no drift. Those monitors are named separately rather than folded into the counts, and they start checking on their own once the placeholder resolves. See Monitor states for the full list.
If no Slack or Microsoft Teams channel is connected yet, the result panel offers a shortcut to set one up. See Messaging.
Turning it off again
Re-opening the dialog for a spec that is already watched turns the primary button into Update drift watch and adds Disable drift watch.
Disabling sets schema validation to Off on that spec's endpoint-linked monitors in that environment. The monitors are deliberately not deleted, so they keep running as plain uptime checks and your uptime history stays intact. A Contract Drift Watch policy stays as well if one was created, because without validation results its drift rule can never fire, and it still carries the downtime rule described under Alerting on drift.
Which contract a check is compared against
A monitor validates against the contract its environment is expected to fulfil, which is the version that environment is pinned to. See environments for how pinning works. Where nothing is pinned, which happens with an unpinned environment or a monitor pointed at a raw URL, validation falls back to the spec's latest published version.
Every drift record names its baseline, so history stays honest when the pin later moves:
| Label | Meaning |
|---|---|
| checked against 2.1.0 (environment pin) | The environment pins that version. A snowflake marks a frozen version whose contract can no longer change. |
| checked against 2.1.0 (latest published) | Nothing is pinned, so validation follows whatever gets published next. |
| Validated against 2.0.0 (environment pin) · 2.1.0 is published | Amber warning on the monitor's detail page: the pin has fallen behind. The monitor keeps checking the old contract, and drift against the newer one stays invisible until you re-pin — a Re-pin button next to it does that. |
The Contract Drift page
Monitoring → Contract Drift answers what is drifting in this project. Its sidebar entry carries an amber badge with the number of endpoints whose drift nobody has picked up yet. Acknowledged events stop counting, which is what makes acknowledging worth anything.
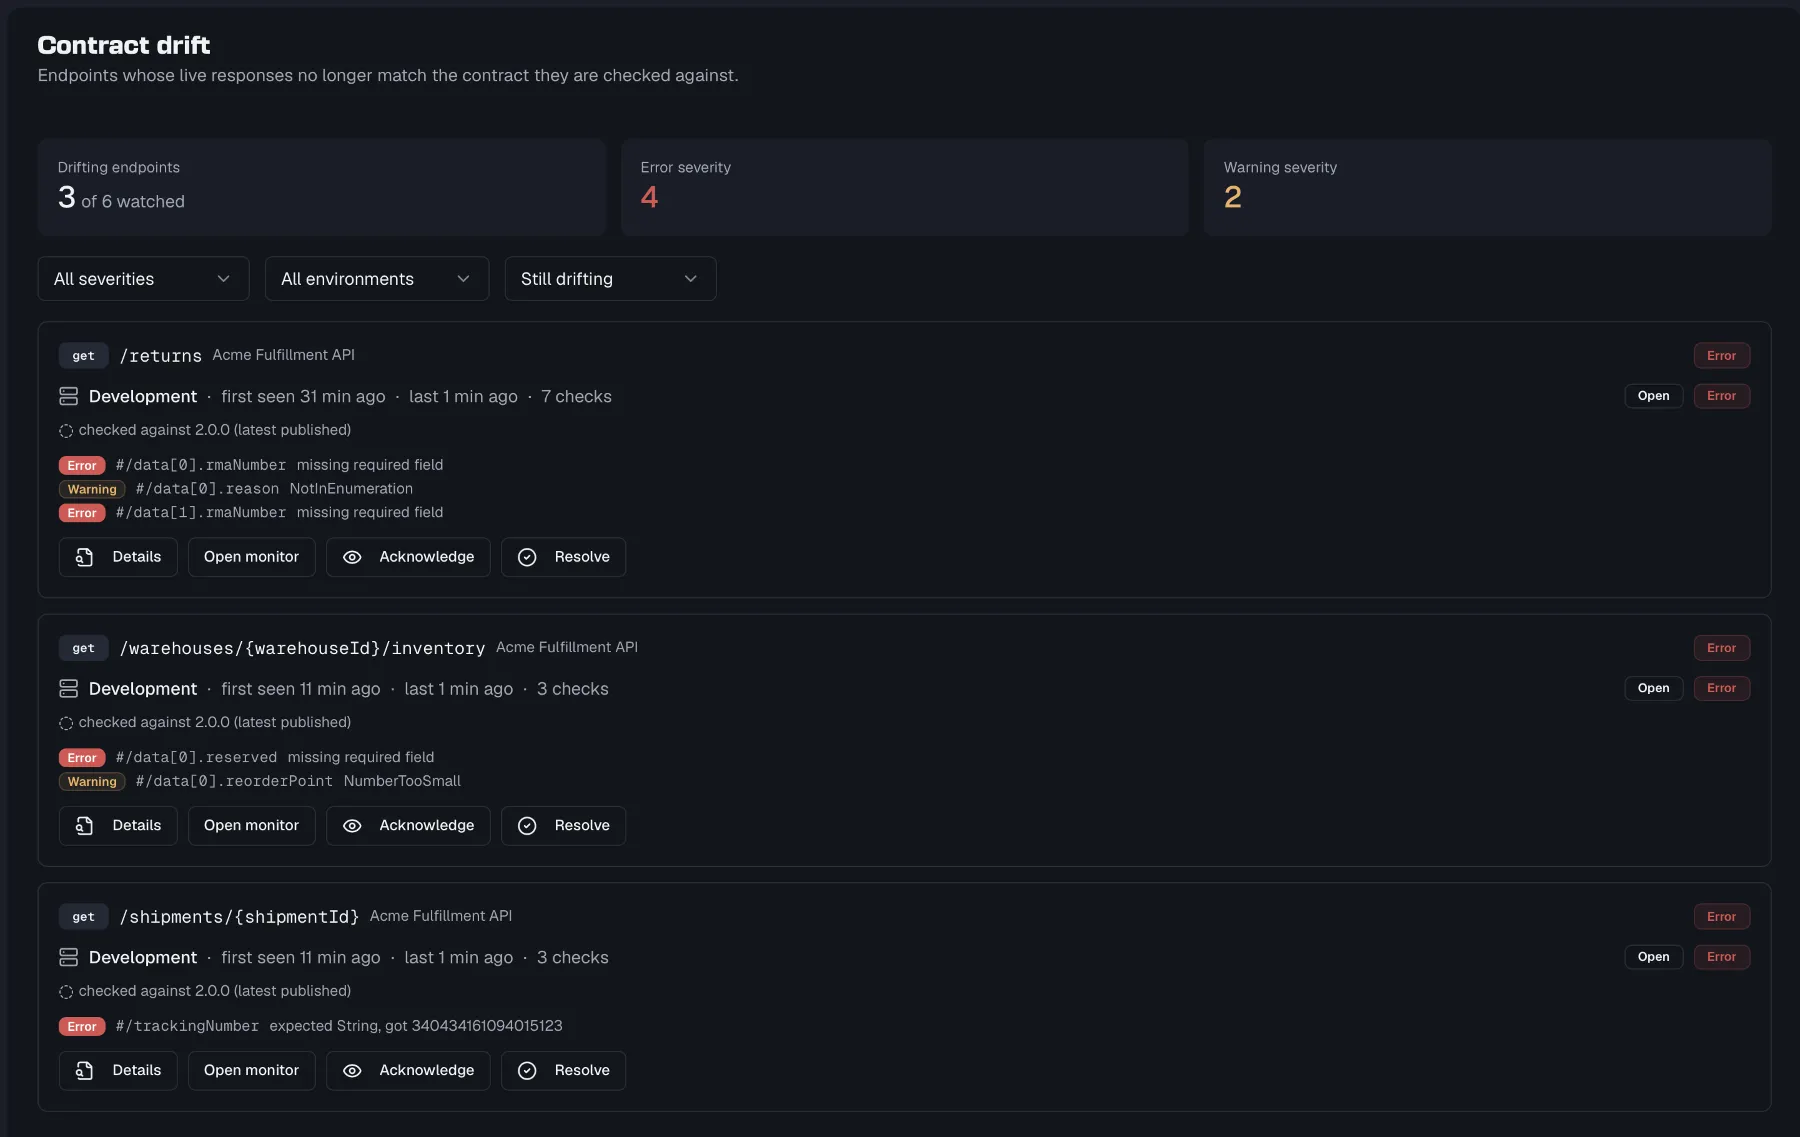
Three figures head the page:
- Drifting endpoints reads N of M watched. A watched monitor is one that could report drift at all, meaning it is linked to an endpoint, has validation on, and is not parked on an unresolved path parameter.
- Error severity and Warning severity give the deviation totals across all unresolved events.
Four filters narrow the list. Minimum severity offers all, error only, or warning and above. Environment appears once monitors are grouped into environments. Status and a lookback period complete the set.
Status and lookback work together in a way worth knowing. Still drifting is the default and hides resolved events entirely. Switch to Including resolved and the lookback appears, offering 24 hours, 7 days or 30 days, and it bounds the resolved history only. Open and acknowledged events are always shown however old they are, because a drift that has been running for six weeks is exactly the one you must not hide behind a time filter.
Results are grouped per endpoint, showing method, path and the specification it belongs to, whose name opens that spec in the API Designer. Underneath sits one row per monitor that saw it, since the same endpoint is usually watched in several environments. Each row shows the environment, first seen, last, how many checks have observed it, the status and severity badges, the baseline, and the deviations themselves.
Three different empty states are on purpose, because they call for opposite actions:
| What you see | What it means |
|---|---|
| No endpoint is being watched for drift | Nothing is configured yet. This is the state that comes with the Watch for drift button. |
| No contract check has run yet | Endpoints are watched, but their checks are not getting a successful response, so nothing has been compared to a contract. It links to the monitors page. |
| No contract drift detected | All N checked endpoints match their contract on the latest check. This is the only one of the three that is actually good news. |
The lifecycle of a drift event
A drift event is a run of the same deviations on one monitor. Its identity is the monitor plus the set of deviating field paths, so if a later deploy changes which fields deviate, that is a new event rather than a silent extension of the old one.
| Status | Meaning |
|---|---|
| Open | Seen, nobody has taken it on. Counts towards the sidebar badge. |
| Acknowledged | Someone owns it. Further sightings do not reset this, and the event keeps counting checks while staying acknowledged. |
| Resolved | Closed, either by a person or by the endpoint itself. |
Two things are recorded rather than inferred. First seen is set once and never moves, so re-opening a resolved event keeps the original date and "drifting since Tuesday" does not reset every time someone closes it. The observation count is the honest answer to how confident you should be, because a deviation seen on 69 checks across two days is a deploy while one seen once is a blip. There is deliberately no confidence score.
Events also close themselves. When a later check finds the endpoint matching its contract again, the event is resolved automatically and the row says "Recovered on its own — a later check matched the contract again." The same happens to an event whose deviations are no longer among what the check sees, even if the endpoint still drifts in some other way, because otherwise it would stay open forever.
With monitoring:write you can Acknowledge, Resolve and Re-open an event, from the list row or from the detail sheet, where an optional note can be attached to the change.
A drift event is deliberately not an incident. A drifting endpoint still answers with a 200, and counting that against uptime would hollow out the number you publish to your customers. The exception is a monitor in Strict mode, where error-severity drift fails the check itself. Those failures count like any other and can open an incident.
The drift detail
Details on any row opens a sheet with everything triage needs.
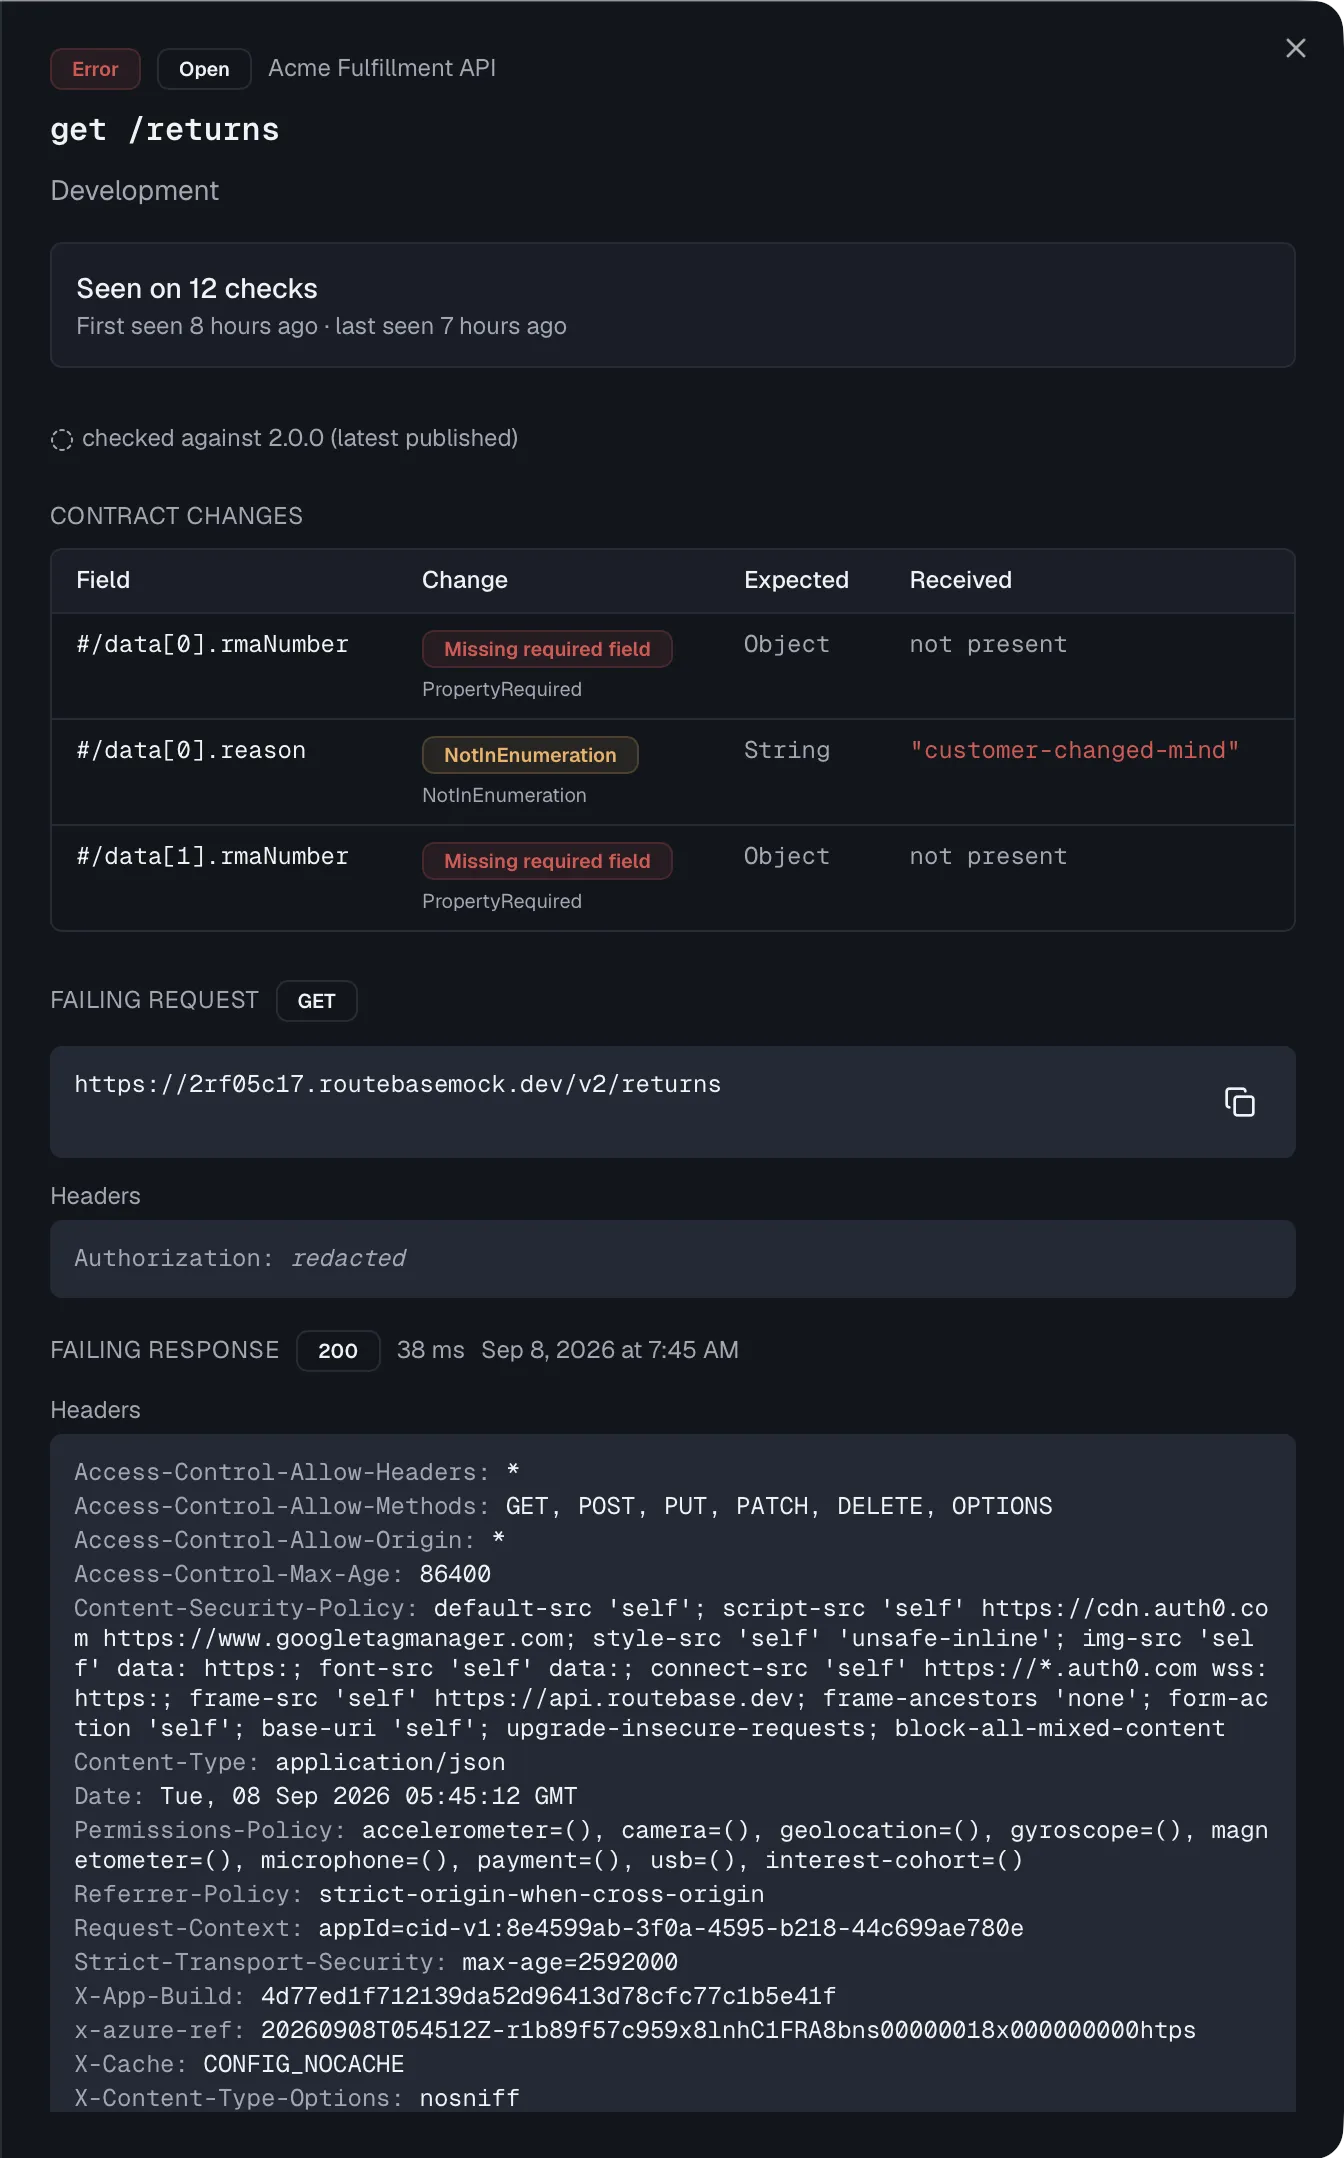
- How persistent it is reads Seen on 34 checks, with first-seen and last-seen timestamps.
- The baseline names what it was checked against.
- Contract changes gives one row per deviation, in four columns because those are the four questions. Field is the path in the response, Change is one of missing required field, type mismatch, extra field or format mismatch, and Expected and Received hold the two values. A field the response did not carry at all reads not present rather than
null, because absent and explicitly null are different bugs and naming the wrong one sends the triage in the wrong direction. - Open in API Designer jumps straight to that endpoint in the spec, so you can compare against what the contract says or change it.
- Open monitor goes to the monitor's detail page with its check history.
The request and the response that produced it
Show request and response loads the exchange the deviations were read from, and it loads both together because a request without its answer is half a story. It is fetched only when asked for, since the body sample alone can be 4 KB per event.
The failing request shows the method, the fully resolved URL, and the headers that were sent, with a note on any header that came from the environment's authentication. The failing response shows the status code, response time, timestamp, headers, and the first 4 KB of the body, pretty-printed when it is JSON. Both the URL and the body can be copied in one click.
A drift event outlives the check that produced it, because drift history is kept while individual checks are swept on the project's retention schedule. The exchange is therefore not always there, and the sheet says which case it is rather than showing an empty panel. The response is either no longer retained, or no response was recorded for that observation, or the observation predates request capture and the next check to see this drift will capture one.
Why nothing here can leak a credential
Everything shown is safe to paste into a ticket, and the mechanism matters more than the promise. The protection is constructive rather than a filter applied afterwards.
The stored URL and header values are resolved using your non-secret variables only. A value marked secret is never substituted in the first place, so its {{name}} placeholder survives into the record instead. A deny-list can have gaps, while a substitution that never happened cannot. This matters because a check materialises credentials in more than one place. Secret variables are decrypted for the live request, and API-key-in-query authentication is appended straight into the query string.
Around that core, four more rules:
- Headers from environment authentication are recorded by name only. That an
Authorizationheader was sent is triage information, while its value is not. - Header names that can carry a credential have their value withheld even when no secret variable was involved, which catches a credential pasted straight into a monitor's header config. That covers anything containing
auth,token,key,secret,credential,cookie,signatureorpassword. The name always stays visible. Something likeX-Idempotency-Keyis withheld needlessly, and that is the right direction to be wrong in. - Auth query parameters are appended as
?apiKey=<redacted>. The key stays readable, the value never does. - Credentials embedded in a base URL such as
https://user:pass@…are stripped from the authority before the URL is stored.
Two limits are documented rather than glossed over. A credential typed literally into a monitor's target URL, or held in a variable that is not marked secret, cannot be recognised as one, so mark secrets as secret. And dynamic tokens like {{$uuid}} stay visible as tokens instead of being re-generated, because a second substitution pass would show you an id that never went out.
Alerting on drift
The alert sharpness you pick in the drift-watch dialog materialises as a real, visible alert policy:
- Breaking changes only creates nothing. The seeded Critical Alerts default policy already alerts on error-severity drift, and drift watch never modifies it.
- Any contract deviation creates a spec-scoped policy named Contract Drift Watch, assigned to that specification. Its drift rule uses warning severity, with a 60-minute cooldown.
That policy appears in your alert policies list, and it carries a downtime rule as well as the drift rule. That is not redundancy, because policy resolution is most-specific-wins and a spec-scoped policy replaces the project default wholesale. Without a mirrored downtime rule the spec would silently lose downtime alerting. Re-running the dialog with a different sharpness updates the same policy instead of creating a second one.
Drift alerts reach you in three places. They appear in the in-app notification center under the Monitoring category, and by email if you enabled that in your notification preferences. In Slack or Microsoft Teams they arrive as a first-class Contract drift category carrying the affected route, the concrete changes and severity colouring. See Messaging.
Where drift shows up elsewhere
- The health dashboard shows a Contract Drift card while endpoints are drifting, listing up to five with their issue count, baseline and top deviations, plus a View all → link to this page. See Monitoring Overview.
- The sidebar carries the amber badge on Contract Drift, counting endpoints with open events.
- The check history marks a check that drifted with a drift badge and its count, on the monitor's detail page. See Monitors.
Permissions
Reading the Contract Drift page and the detail sheet needs monitoring:read, which Members have. Enabling or disabling drift watch and changing an event's status needs monitoring:write, which Admins and Owners have. Without it the page is fully readable and the actions are hidden.
Related
- Schema Drift — how a single monitor validates a response, and what the change types mean
- Monitors — the checks drift detection rides along on
- Alert Policies — where the Contract Drift Watch policy shows up
- Messaging — drift alerts in Slack and Microsoft Teams
- Environments — the version pin that decides which contract is checked
- Contract Testing — the same question asked before deployment instead of after