

Incidents
When a monitor keeps failing, Routebase opens an incident, which is a tracked record of the outage with its cause, duration and a timeline of what happened. Incidents live under Monitoring → Incidents, and the sidebar entry shows a red badge with the number of currently open incidents.
When an incident opens
An incident opens once a monitor accumulates enough consecutive failed checks to cross the project's incident threshold (default 3, configurable from 1–100 under Monitoring → Settings). Two things prevent that:
- An active maintenance window covering the monitor, because failed checks during maintenance don't open incidents.
- A disabled monitor, because it isn't checked at all.
Incident lifecycle
Incidents move through three states:
| Status | Meaning |
|---|---|
| Open | The incident is active and unhandled. |
| Acknowledged | Someone has seen it and is working on it. |
| Resolved | The underlying problem is cleared. |
Acknowledge is available while an incident is open, and Resolve is available until the incident is resolved. Both actions require the monitoring:write permission.
The Incidents page
The table lists every incident with its Status, Monitor, Environment, Duration (live-updating for ongoing incidents), and Started time, 25 per page. Filter by:
- Status offers All Statuses, Open, Acknowledged and Resolved.
- Environment appears once your monitors are grouped into environments.
- Date range filters between a From and a To date.
With no incidents on record you'll see "No incidents recorded. All systems operational.", which is the best empty state there is.
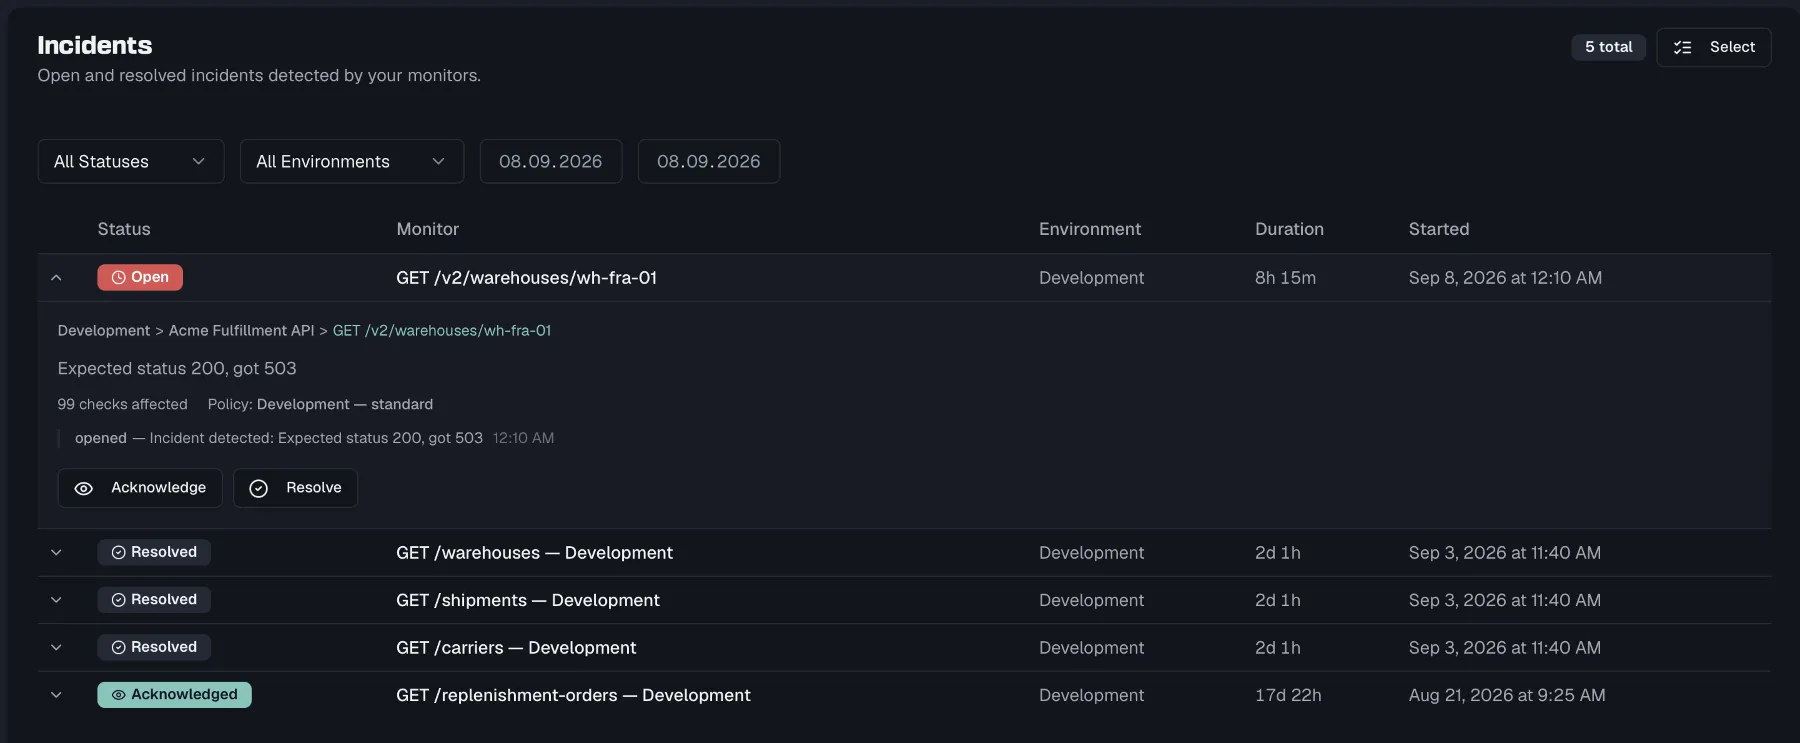
Incident detail and timeline
Click a row to expand it inline. The detail shows:
- A context breadcrumb of environment → API spec → monitor, with the monitor name linking to its detail page.
- The cause and how many checks were affected.
- The policy that triggered it (see Alert Policies).
- The event timeline, where each event carries its type, message and timestamp, so you can trace when the incident opened, was acknowledged and was resolved.
- Inline Acknowledge and Resolve buttons for unresolved incidents.
Bulk actions
To handle many incidents at once, click Select in the page header. Checkboxes appear per row, plus a select-all in the header. Pick the incidents and click Acknowledge or Resolve. A confirmation dialog summarizes how many incidents the action affects.
Incidents elsewhere
Open incidents also surface on the Health Dashboard in the Active Incidents card, with the same expandable detail and inline actions. And every incident event lands in the notification center under the Monitoring category. See notification preferences for in-app and email delivery.
Related
- Monitors — the checks whose failures open incidents
- Alert Policies — the rules that decide when to alert
- Maintenance Windows — planned downtime that suppresses incidents