

Monitoring Overview
Routebase Monitoring runs scheduled health checks against your live APIs, tracks uptime and latency over time, and opens incidents the moment something breaks. That way you hear about an outage from your dashboard rather than from your customers. Because monitors can be linked to your documented endpoints, every check can also validate the live response against your OpenAPI schema and catch contract drift in production.
Monitoring requires the Pro plan. On lower tiers the Monitoring area shows an upgrade prompt instead. It also runs per project. Select a project first, or you'll see an onboarding screen asking you to pick one.
How the pieces fit
A monitor pings one target on a fixed interval and records each result as a check. From those checks Routebase derives a current status, uptime percentages, and response-time trends. When failures cross your configured thresholds, an alert fires, and after enough consecutive failures an incident opens. You acknowledge and resolve incidents, and you can mute the whole machinery during planned maintenance windows.
| Concept | What it is | Guide |
|---|---|---|
| Monitor | A scheduled HTTP check against one URL or endpoint | Monitors |
| Check | One execution of a monitor, with timings and result | Monitors |
| Alert policy | Reusable alert rules assigned to monitors, specs, or environments | Alert Policies |
| Incident | A tracked outage opened by consecutive failed checks | Incidents |
| Maintenance window | A scheduled period in which failures don't open incidents | Maintenance Windows |
| Schema drift | Differences between a live response and your spec, detected on a single check | Schema Drift |
| Drift event | A run of the same deviations on one endpoint, with a first-seen date and a lifecycle | Contract Drift |
| Coverage | How much of each spec is monitored | Coverage |
Navigating the Monitoring area
The Monitoring sidebar has six entries:
| Page | What it covers |
|---|---|
| Dashboard | A health overview with status counts, uptime, active incidents, contract drift and spec coverage |
| Monitors | All monitors, plus an inline tree grouped by environment and spec |
| Incidents | Every incident in the project, with filters and bulk actions. A red badge shows the number of open incidents. |
| Contract Drift | Every endpoint whose live responses no longer match its contract, grouped per endpoint and environment. An amber badge shows how many have drift nobody has picked up yet. |
| Alert Policies | Reusable alert rules you assign to monitors, environments, or specs |
| Settings | Project defaults, data retention, spec-publish behavior, and the maintenance-window calendar |
On smaller screens the sidebar collapses into a menu button that opens the same navigation in a sheet.
The Health Dashboard
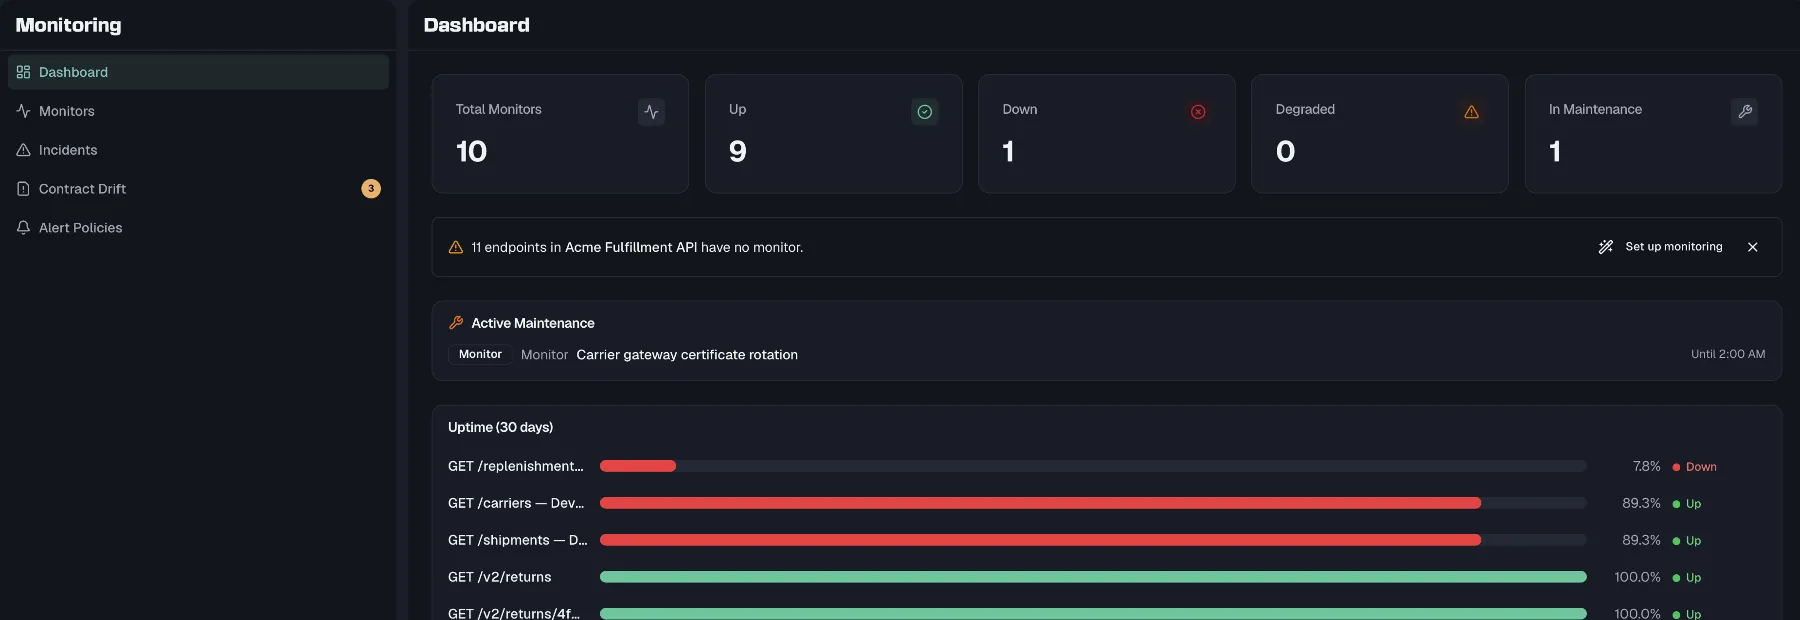
Dashboard is the default view when you open Monitoring. It summarizes the project's health at a glance:
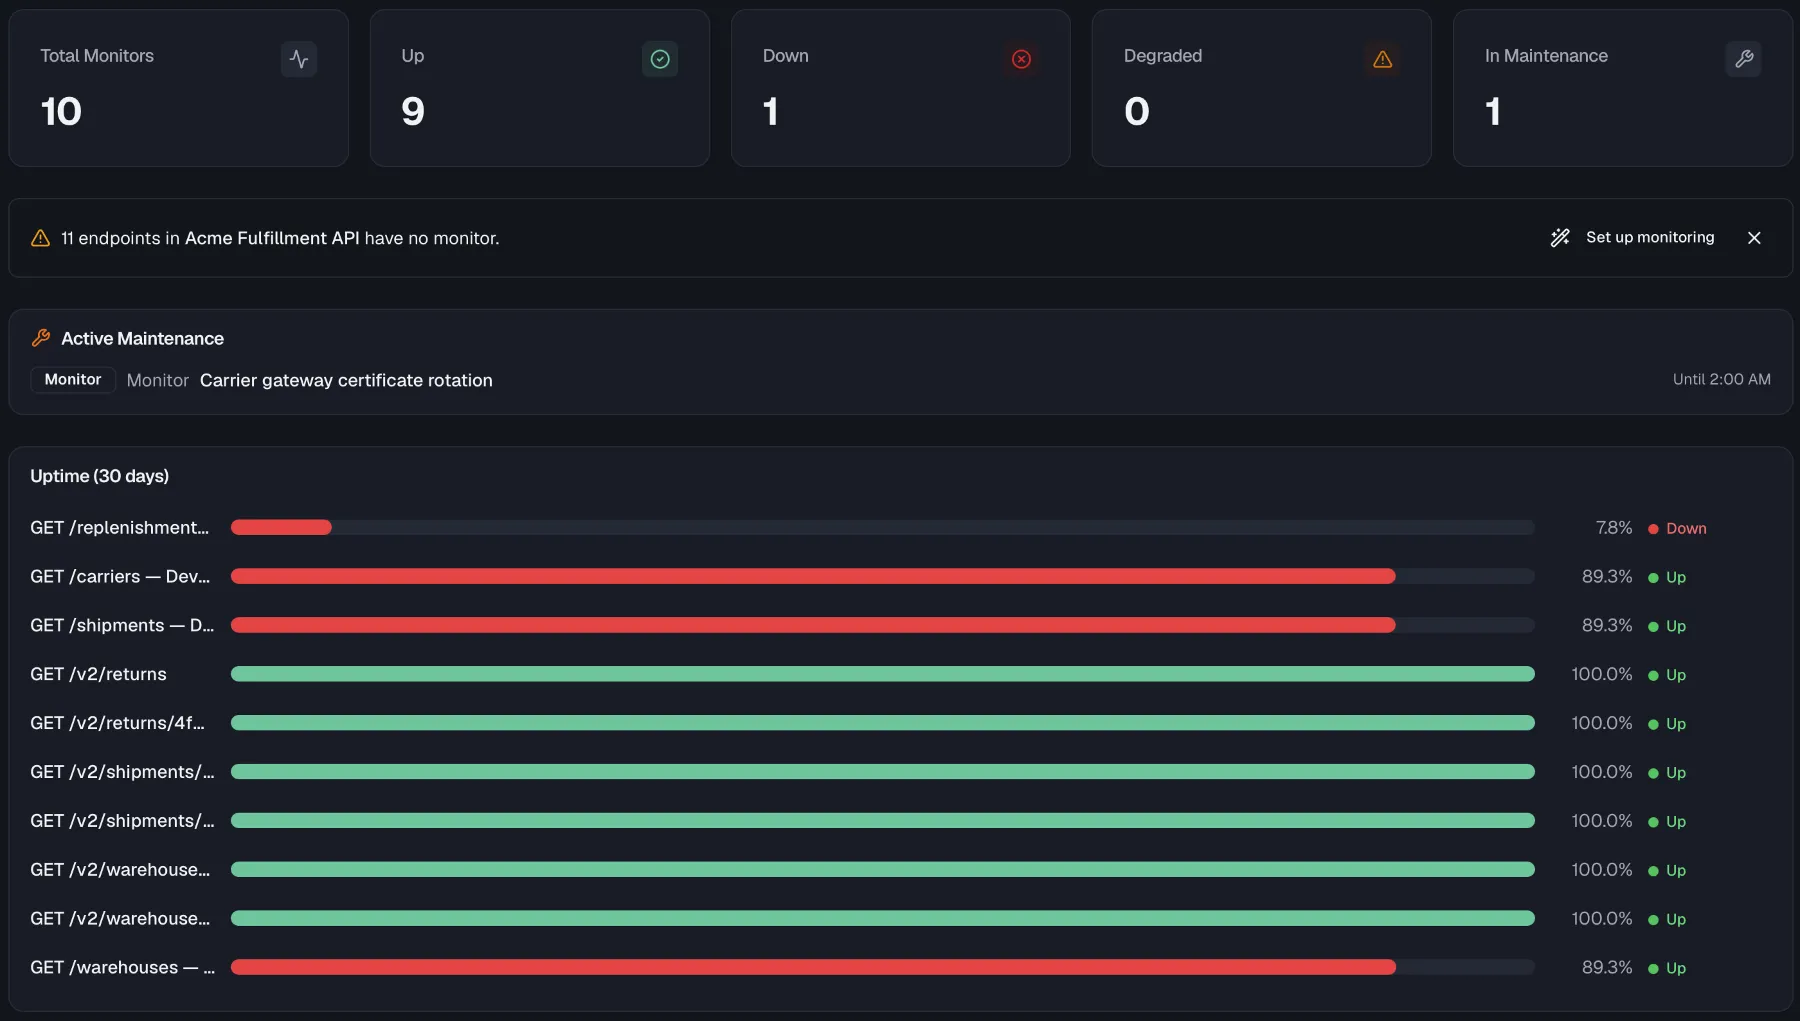
- Stat cards show the Total Monitors, Up, Down, Degraded and In Maintenance counts.
- Coverage hints are dismissable banners that appear when a spec has endpoints without monitors, and each one carries a Set up monitoring shortcut. See Coverage.
- Active Maintenance lists the windows suppressing alerts right now, each with its scope and end time.
- Uptime (30 days) gives one bar per monitor showing its 30-day uptime percentage. The bars are color-coded, with green at 99.5% and above, yellow at 95% and above and red below that, and they are sorted so failing monitors come first. Click a row to jump to that monitor.
- Active Incidents appears while incidents are open, with inline Acknowledge and Resolve actions.
- Contract Drift appears while watched endpoints are drifting. It lists up to five of them with their issue count, the contract version they were checked against and their top deviations, and it links onward with View all →. See Contract Drift.
- Spec Coverage shows per-spec progress bars with a Generate Missing shortcut.
If the project has no monitors yet, the dashboard shows a setup screen headed "Set up your first monitor" instead. It offers two starting points, which are Single monitor for a check against one URL or endpoint and Generate from spec for a monitor on every endpoint in your spec. The second option is disabled until the project has an API spec.
Monitor status
Every monitor shows a current status derived from its recent checks:
| Status | Meaning |
|---|---|
| Up | Recent checks are passing. |
| Down | Checks are failing. |
| Degraded | Working but unhealthy, for example slow or intermittently failing. |
| Unknown | Not enough data yet (for example, a brand-new monitor). |
| Waiting (for deployment) | The endpoint has never answered yet, so the contract is ahead of the service. |
| Waiting (for parameters) | The target URL still carries an unresolved path parameter, so no check can run. |
Both Waiting states are normal in design-first work, not defects, and both are filter values on the Monitors page. They share a badge label and are told apart by its tooltip.
Waiting for deployment is the state of a freshly generated monitor whose endpoint the environment does not serve yet. Red tests are annoying, and alarming monitors wake people up, so a monitor whose endpoint has never answered waits instead. It stays visible, raises no alert, opens no incident and is excluded from the uptime figures, and it activates itself the moment the endpoint responds.
Waiting for parameters is one step earlier, because the address itself is incomplete when a path parameter like {id} was never given a value. No check runs at all, so nothing is written to the history and the uptime figure stays honest. Set the value and the next scheduled check runs normally. You can also re-run drift watch, which fills parameters from the spec's examples.
Project settings
Under Settings you control the project-wide behavior of monitoring. Changing defaults doesn't touch existing monitors.
| Setting | What it does |
|---|---|
| Check interval (seconds) | Default interval for new monitors. Range 30–86400 seconds (24h). |
| Request timeout (seconds) | Default timeout for new monitors. Range 1–120 seconds. |
| Incident threshold | Consecutive failed checks needed to open an incident. Range 1–100. |
| Schema validation mode | The default for new monitors. Off disables validation, Warn logs drift and keeps the check successful, and Strict fails the check on error-severity drift. |
| Auto-create monitors for new endpoints | On spec publish, automatically create a monitor for each endpoint that isn't monitored yet. When off, you only get a notification about new unmonitored endpoints. |
| Retention period (days) | Check records older than this are deleted nightly. Range 1–365 days. Incidents and uptime stats are kept independently. |
The same page lists every maintenance window in the project. See Maintenance Windows.
Notifications
Monitoring events such as alerts firing, incidents opening and contract drift appear in the in-app notification center under the Monitoring category. You control in-app and email delivery per category in your notification preferences.
They can also go straight into a chat channel, because Slack and Microsoft Teams are first-class delivery targets with their own Contract drift, Monitor incident and Monitor recovered categories. See Messaging.
Permissions
| Permission | Grants |
|---|---|
monitoring:read |
View monitors, checks, incidents, policies, and dashboards. Editing controls are hidden. Members have this. |
monitoring:write |
Create and edit monitors, manage alert policies and assignments, acknowledge and resolve incidents, schedule maintenance, and change settings. Admins and Owners have this. |
Related
- Monitors — creating and managing health checks
- Alert Policies — when and how you get alerted
- Incidents — tracking and resolving outages
- Contract Drift — the project-wide view of endpoints that stopped matching their contract
- Schema Drift — validating live responses against your spec
- Coverage — keeping monitoring in step with your API